EPA-Regulated Manufacturing Facilities (ECHO)
U.S. · 171,649 locations
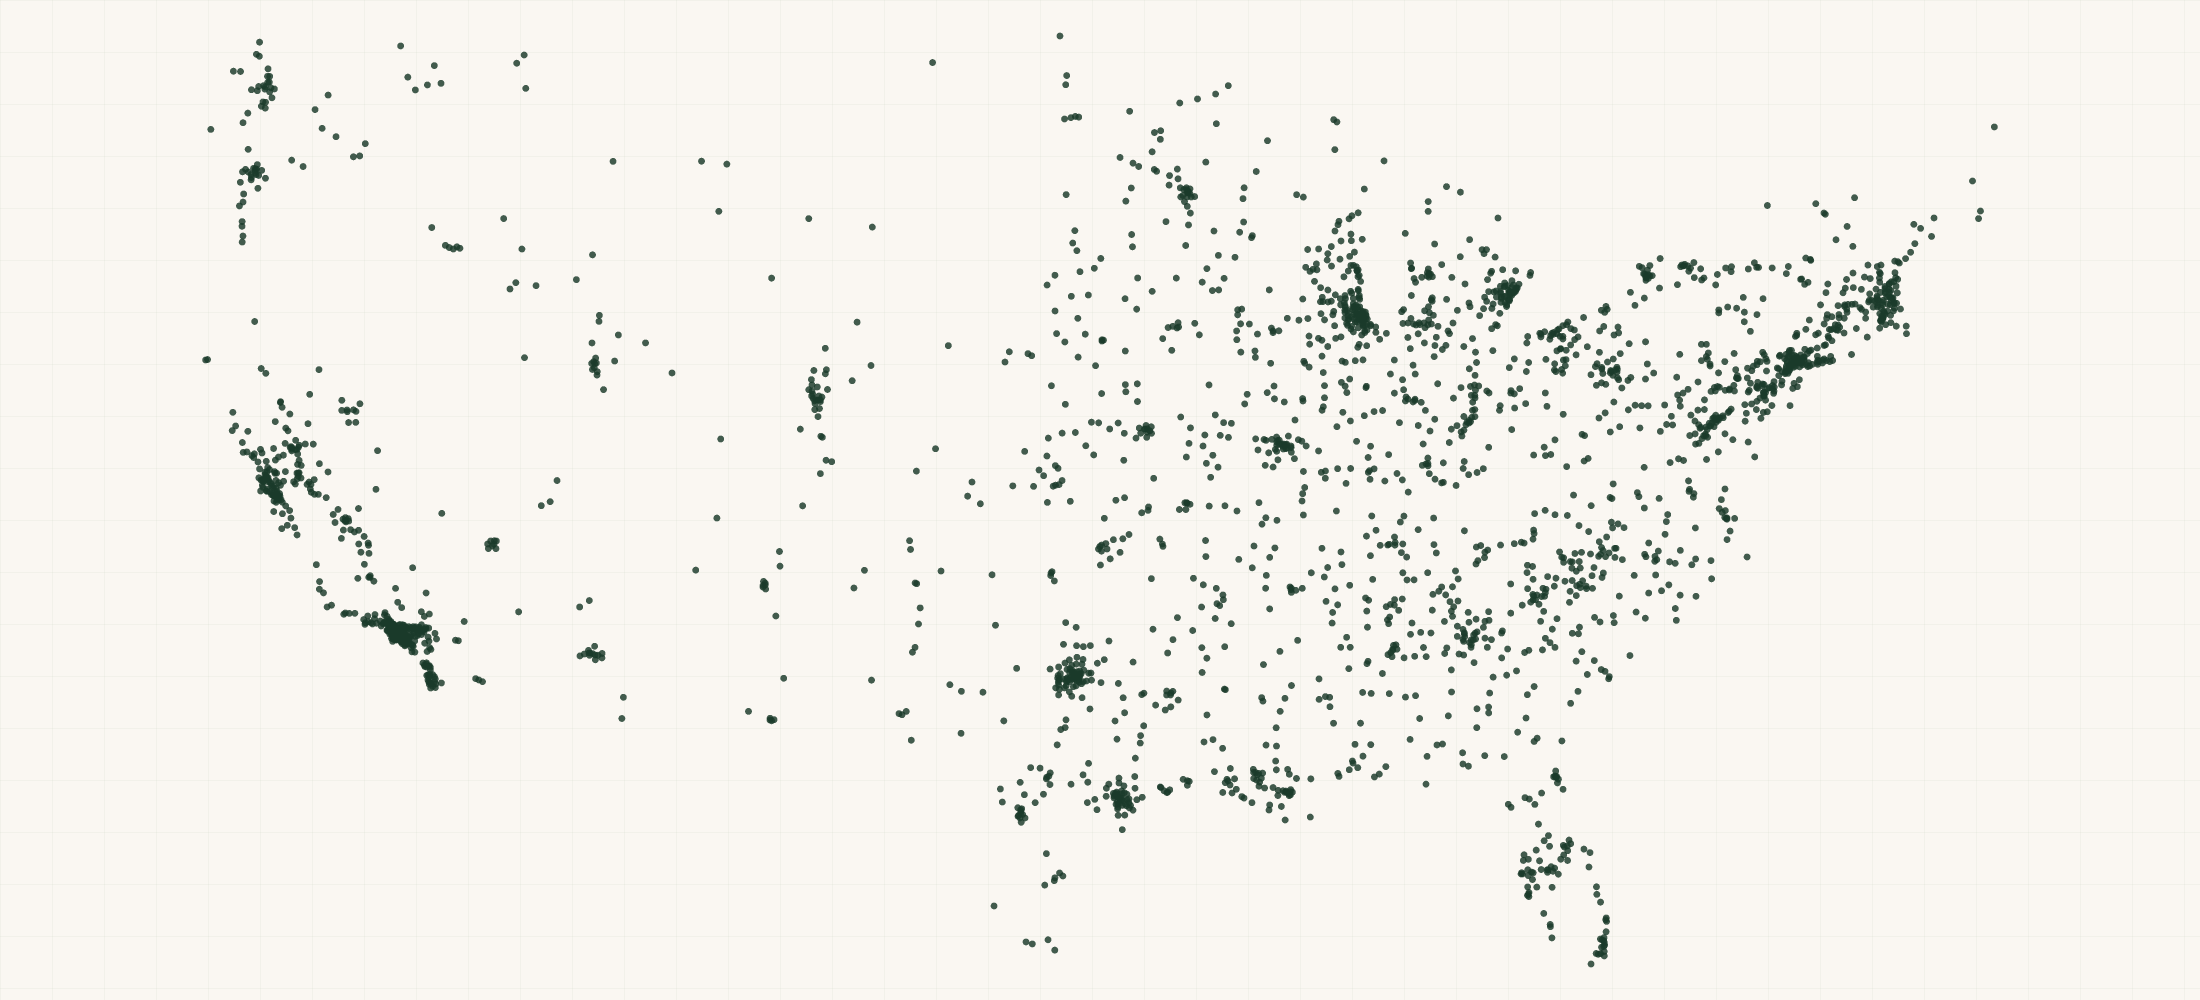
There are 171,649 EPA-Regulated Manufacturing Facilities (ECHO) in the US as of October 2026. They are in all 50 states, DC and Puerto Rico.
171,649 active manufacturing facilities in EPA's Enforcement and Compliance History Online (ECHO), downloaded on 26 October 2026 as the ECHO Exporter file of 25 October.
More about this list
A facility is in when EPA lists a manufacturing NAICS code for it (146,289), or a manufacturing SIC code where it lists no NAICS (25,360). California has 35,542, Texas 14,404 and Illinois 9,391. Each row carries all 133 ECHO columns. Under the Clean Air Act, Clean Water Act, RCRA and the Safe Drinking Water Act it gives program ids, permit types, inspections, actions, penalties and quarter-by-quarter compliance. 45,780 were inspected in the last five years. 11,881 have a violation identified, 4,138 of them significant. 6,126 have an assessed penalty and 27,058 have a federal enforcement case. ECHO has no phone or email. 38,574 rows carry the public contact from the facility's TRI forms. 29,688 sit in a Section 232 sector by NAICS code.
Need just some of them? Ask in your own words.
●Where the rows are
≡Sample Data Preview
| name | address | city | state | zip | county | manufacturing naics codes | manufacturing sic codes | industry basis | section232 sector | tri public contact name | tri public contact phone | tri public contact email | tri contact facility id | id basis | frs id | fips code | epa region | indian cntry flg | federal flg | us mex border flg | chesapeake bay flg | naa flag | map icon | collection method | reference point | accuracy meters | derived tribes | derived huc | derived wbd | derived stcty fips | derived zip | derived cd113 | derived cb2010 | percent minority | major flag | active flag | myrtk universe | inspection count | date last inspection | days last inspection | informal count | date last informal action | formal action count | date last formal action | total penalties | penalty count | date last penalty | last penalty amt | qtrs with nc | programs with snc | compliance status | snc flg | three year compliance history | air flag | npdes flag | sdwis flag | rcra flag | tri flag | ghg flag | air ids | caa permit types | caa naics | caa sics | caa evaluation count | caa days last evaluation | caa informal count | caa formal action count | caa date last formal action | caa penalties | caa last penalty date | caa last penalty amt | caa qtrs with nc | caa compliance status | caa hpv flag | caa3yr compl qtrs history | npdes ids | cwa permit types | cwa compliance tracking | cwa naics | cwa sics | cwa inspection count | cwa days last inspection | cwa informal count | cwa formal action count | cwa date last formal action | cwa penalties | cwa last penalty date | cwa last penalty amt | cwa qtrs with nc | cwa compliance status | cwa snc flag | cwa13qtrs compl history | cwa13qtrs efflnt exceedances | cwa3 yr qncr codes | rcra ids | rcra permit types | rcra naics | rcra inspection count | rcra days last evaluation | rcra informal count | rcra formal action count | rcra date last formal action | rcra penalties | rcra last penalty date | rcra last penalty amt | rcra qtrs with nc | rcra compliance status | rcra snc flag | rcra3yr compl qtrs history | sdwa ids | sdwa system types | sdwa informal count | sdwa formal action count | sdwa compliance status | sdwa snc flag | tri ids | tri releases transfers | tri on site releases | tri off site transfers | tri reporter in past | fec case ids | fec number of cases | fec last case date | fec total penalties | ghg ids | ghg co2 releases | sic codes | naics codes | date last inspection epa | date last inspection state | date last formal act epa | date last formal act st | date last informal act epa | date last informal act st | federal agency | tri reporter | imp water flg | row id | source file | source date | directions url | updated date | geo precision | county fips | county note | address quality | country | latitude | longitude | source url |
|---|---|---|---|---|---|---|---|---|---|---|---|---|---|---|---|---|---|---|---|---|---|---|---|---|---|---|---|---|---|---|---|---|---|---|---|---|---|---|---|---|---|---|---|---|---|---|---|---|---|---|---|---|---|---|---|---|---|---|---|---|---|---|---|---|---|---|---|---|---|---|---|---|---|---|---|---|---|---|---|---|---|---|---|---|---|---|---|---|---|---|---|---|---|---|---|---|---|---|---|---|---|---|---|---|---|---|---|---|---|---|---|---|---|---|---|---|---|---|---|---|---|---|---|---|---|---|---|---|---|---|---|---|---|---|---|---|---|---|---|---|---|---|---|---|---|---|---|---|---|---|
| PGP Campbell Lake | (Unknown Address) | (Unknown City) | AK | 99502 | Anchorage Municipality | 325320 | 2879 | NAICS | FRS id | 110072179435 | 02020 | 10 | N | N | no_ll.png | Zip Code Centroid | 10000 | Y | NNN | 0 | 0 | 0 | 0 | 0 | 0 | 0 | No Violation Identified | N | ____________ | N | Y | N | N | N | N | N | AKG870030 | Non-M | On | 325320 | 2879 | 0 | No Violation Identified | N | _____________ | N | N | 2879 | 325320 | 110072179435 | https://echo.epa.gov/files/echodownloads/echo_exporter.zip | 2026-10-25 | https://www.google.com/maps/dir/?api=1&destination=61.163652%2C-149.996643 | 2026-10-27 | source | 02020 | no_house_number | US | 61.163652 | -149.996643 | http://echo.epa.gov/detailed-facility-report?fid=110072179435 | |||||||||||||||||||||||||||||||||||||||||||||||||||||||||||||||||||||||||||||||||||||||||
| Chemtrade Solutions LLC - Augusta | GA | Richmond County | 325180 | NAICS | FRS id | 110071452994 | N | N | RCRA-IC-MN-N.png | UNKNOWN | 81.886 | Y | NNN | 0 | 0 | 0 | 0 | 0 | 0 | 0 | No Violation Identified | N | ____________ | N | N | N | Y | N | N | N | N | GAR000096669 | SQG | 325180 | 0 | No Violation Identified | N | ____________ | N | 325180 | 110071452994 | https://echo.epa.gov/files/echodownloads/echo_exporter.zip | 2026-10-25 | https://www.google.com/maps/dir/?api=1&destination=33.433335%2C-81.934735 | 2026-10-27 | source | 13245 | missing | US | 33.433335 | -81.934735 | http://echo.epa.gov/detailed-facility-report?fid=110071452994 | ||||||||||||||||||||||||||||||||||||||||||||||||||||||||||||||||||||||||||||||||||||||||||||||||||
| Maryland Paving Inc. | 1401 Carsins Run Road | Aberdeen | MD | 21001 | Harford County | 324121 | 2951 | NAICS | Jeremy Dickson | (410) 771-4311 | JDICKSON@GRAYNSON.COM | 21001MRYLN141CA | FRS id | 110009684092 | 24025 | 03 | N | Y | Y | MULT-IC-MN-4.png | ADDRESS MATCHING-HOUSE NUMBER | CENTER OF A FACILITY OR STATION | 30 | 02060003 | 020600030105 | 24025 | 21001 | 01 | 240253037001013 | 37.37 | Y | NNN | 2 | 2023-03-21 | 1314 | 1 | 2026-02-06 | 1 | 2026-05-21 | 14000 | 1 | 2026-05-21 | 14000 | 3 | 0 | No Violation Identified | N | ________SSS_ | Y | N | N | Y | Y | N | MD0000002402500031 | 80% Synthetic Minor Emissions | 324121 | 2 | 10763 | 1 | 1 | 2026-05-21 | 14000 | 2026-05-21 | 14000 | 3 | No Violation Identified | N | ________SSS_ | N | MDD003098217 | Other | 324121 | 0 | No Violation Identified | N | ____________ | N | 21001MRYLN141CA | 0 | 0 | 0 | Y | MD000A200290501 | 2951 | 324121 | 1997-05-06 | 2023-03-21 | 2026-05-21 | 2026-02-06 | Y | 110009684092 | https://echo.epa.gov/files/echodownloads/echo_exporter.zip | 2026-10-25 | https://www.google.com/maps/dir/?api=1&destination=39.52007%2C-76.22724 | 2026-10-27 | source | 24025 | complete | US | 39.52007 | -76.22724 | http://echo.epa.gov/detailed-facility-report?fid=110009684092 | |||||||||||||||||||||||||||||||||||||||||||||||
| Prime Choice Wood Priming | 288 Pinewood Road | Allenstown | NH | 03275 | Merrimack County | 321114 | NAICS | timber and lumber | FRS id | 110001524093 | 33013 | 01 | N | Y | MULT-IC-MN-N.png | ADDRESS MATCHING-HOUSE NUMBER | CENTER OF A FACILITY OR STATION | 30 | 01070006 | 010700060503 | 33013 | 03275 | 02 | 330130031001039 | 4.761 | Y | NNN | 0 | 2018-03-14 | 3147 | 0 | 2019-06-04 | 0 | 2020-08-12 | 0 | 2020-08-12 | 6952 | 0 | 0 | No Violation Identified | N | ____________ | Y | N | N | Y | N | N | NH0000003301390438 | Synthetic Minor Emissions | 423330 | 3146 | 2020-08-12 | 2020-08-12 | 6952 | 0 | No Violation Identified | N | ____________ | N | NHD510189558 | Other | 0 | No Violation Identified | N | ____________ | N | NH000A0000330139043800013 NH000A0000330139043800014 | 321114 423330 | 2018-03-14 | 2020-08-12 | 2019-06-04 | 110001524093 | https://echo.epa.gov/files/echodownloads/echo_exporter.zip | 2026-10-25 | https://www.google.com/maps/dir/?api=1&destination=43.15387%2C-71.40597 | 2026-10-27 | source | 33013 | complete | US | 43.15387 | -71.40597 | http://echo.epa.gov/detailed-facility-report?fid=110001524093 | ||||||||||||||||||||||||||||||||||||||||||||||||||||||||||||||||||
| Burnstein Precision Casting | 608 Carwellyn Rd | Abbeville | SC | 29620 | Abbeville County | 331423 331491 331529 332813 | 3366 3471 | NAICS | critical minerals | Danny Burnstein | (864) 366-2527 | BURN4@WCTEL.NET | 29620BRNSTCARWE | FRS id | 110007833522 | 45001 | 04 | N | N | MULT-IC-MN-3.png | ADDRESS MATCHING-HOUSE NUMBER | CENTER OF A FACILITY OR STATION | 30 | 03060103 | 030601030605 | 45001 | 29620 | 03 | 450019505004025 | 47.286 | Y | NNN | 2 | 2024-05-21 | 887 | 3 | 2024-05-07 | 1 | 2024-08-19 | 7500 | 1 | 2024-08-19 | 7500 | 3 | 0 | No Violation Identified | N | VVV_________ | Y | Y | N | Y | Y | N | SC00000400038 | Minor Emissions | 331529 | 2011-06-03 | 2011-06-03 | 10300 | 0 | No Violation Identified | N | ____________ | SCR003166 | Non-M | Off | 3366 | 1 | 886 | 0 | Terminated Permit | N | SCD982076010 SCR000765305 | Other, SQG | 331491 | 1 | 8796 | 3 | 1 | 2024-08-19 | 7500 | 2024-08-19 | 7500 | 3 | No Violation Identified | N | VVV_________ | N | 29620BRNSTCARWE | 360010 | 10 | 360000 | Y | 04-2005-2014 SC000A0040003800009 | 2004-11-03 | 3366 3471 | 331423 331491 331529 332813 | 2002-09-24 | 2024-05-21 | 2004-11-03 | 2024-08-19 | 2024-05-07 | Y | 110007833522 | https://echo.epa.gov/files/echodownloads/echo_exporter.zip | 2026-10-25 | https://www.google.com/maps/dir/?api=1&destination=34.16383%2C-82.40205 | 2026-10-27 | source | 45001 | ZIP 29620 spans 2 counties; assigned to the county holding 96% of its land area | complete | US | 34.16383 | -82.40205 | http://echo.epa.gov/detailed-facility-report?fid=110007833522 |
{}What's in each row
| Field | What it is | Rows filled |
|---|---|---|
| name | Facility or permit holder name as kept in EPA's Facility Registry Service (all-capitals names set in title case) | 100% |
| address | Street address as kept in EPA's Facility Registry Service | 100% |
| city | City | 100% |
| state | Two-letter state code | 100% |
| zip | Five-digit ZIP code | 100% |
| county | County name | 100% |
| country | Country (US) | 100% |
| latitude | Latitude EPA publishes for the facility | 100% |
| longitude | Longitude EPA publishes for the facility | 100% |
| manufacturing | The facility's NAICS codes that are manufacturing (31-33) | 85% |
| manufacturing | The facility's SIC codes that are manufacturing (20-39) | 57% |
| industry | NAICS when EPA lists a NAICS code for the facility; SIC when it lists only SIC codes | 100% |
| section232 | Section 232 investigation the facility's NAICS codes fall under (steel, aluminum, timber and lumber, autos and parts and others); blank when none | 17% |
| tri | Public contact on the facility's TRI forms, from EPA's TRI facility table (facilities that report to TRI) | 23% |
| tri | TRI public contact's phone | 22% |
| tri | TRI public contact's email | 16% |
| tri | TRI facility id the contact comes from | 23% |
| id | FRS id, or program id where EPA has not linked the facility to an FRS id yet | 100% |
| frs | EPA Facility Registry Service id: links the facility across EPA programs (blank where EPA has not assigned one) | 100% |
| fips | The 2 digit State FIPS code concatenated with the 3 digit County FIPS code. | 99% |
| epa | EPA Region. | 89% |
| indian | FRS Tribal Code Flag - a Y/N flag indicating whether or not an associated EPA program reported the facility as being within an Indian country or Alaska boundary. | 100% |
| us | A Y/N flag indicating that the facility is within 100km of the US-Mexico Border. | 30% |
| chesapeake | Flag designating that the facility is located within the Chesapeake Bay watershed. | 4% |
| naa | A Y/N flag indicating that the facility is within an Air Non Attainment area. | 100% |
| map | The default map icon image file calculated for the facility by the ECHO program. | 100% |
| collection | A description of the method used to determine the latitude and longitude coordinates for the provided facility coordinate. | 91% |
| reference | A description of the location for the provided facility coordinate. | 87% |
| accuracy | The estimate of accuracy based on provided spatial metadata and quality assurance routines for the provided facility coordinate. | 99% |
| derived | A list of the Native American tribes and Native Alaskan Villages that were determined to be within 25 miles of the facility coordinate - the distance in miles from the tribal or village boundary is also provided. | 23% |
| derived | The 8 digit Watershed Hydrologic Unit Code (HUC) derived from the facility coordinate. | 97% |
| derived | The 12 digit Watershed Boundary Dataset code derived from the facility coordinate. | 97% |
| derived | The 2 digit State FIPS code concatenated with the 3 digit County FIPS code derived from the facility coordinate. | 97% |
| derived | The 5 digit ZIP code derived from the facility coordinate. | 97% |
| derived | The 113th Congressional District derived from the facility coordinate. | 97% |
| derived | The 2010 Census Block derived from the facility coordinate. | 97% |
| percent | The percentage of the population within a 3-mile radius that is minority. | 89% |
| major | Determines if the facility is a designated as a major. | 5% |
| active | A Y/N flag indicating if any of the associated ICIS-Air, ICIS-NPDES, RCRA or SDWA permits are in an active status. | 100% |
| myrtk | A 3 digit combination of Y/N flags indicating if the facility is considered a myRTK (http://myrtk.epa.gov/info/info.jsp) facility under the CAA (position 1), CWA (position 2), or RCRA (position 3). | 100% |
| inspection | The number of inspections/compliance evaluations that have occurred at the facility, under the CAA, CWA, and RCRA, within the last five years. | 100% |
| date | The date on which most recent inspection of the facility took place. | 49% |
| days | The number of days from the last ECHO refresh to the date on which the most recent inspection of the facility took place based on data recorded into ICIS-Air, ICIS-NPDES, or RCRAInfo. | 49% |
| informal | Indicates the number of informal enforcement actions/NOVs that have been taken against the facility within the twenty most recently completed quarters (5 years). | 100% |
| date | The date of the most recent informal action or NOV taken recorded in ICIS-Air, ICIS-NPDES, RCRAInfo or SDWIS. | 34% |
| formal | The count of all of the formal enforcement actions that addressed the facility from the following systems: ICIS-Air, ICIS-NPDES, SDWIS and RCRAInfo. | 100% |
| date | Indicates the effective date of the most recent listed enforcement action. | 19% |
| total | The total dollar amount of either assessed (or final) penalties. | 100% |
| penalty | The count of all penalties assessed in the last 5 years against the facility taken from the following systems: ICIS, ICIS-Air, ICIS-NPDES, and RCRAInfo. | 4% |
| date | Date of the most recent assessed penalty | 15% |
| last | The total dollar amount of the most recent assessed (or final) penalty given to a facility. | 100% |
| qtrs | Count of the number of quarters, out of the last twelve quarters, in which the permit or site is considered either in Noncompliance (NC), Significant Noncompliance (SNC) or High Priority violation (HPV) status. | 98% |
| programs | A count of the number of programs (CAA, CWA, SDWA, RCRA) related to the facility that have a serious violation. | 100% |
| compliance | Overall compliance status. | 97% |
| snc | Identifies whether the facility is a High Priority Violator (HPV) for CAA, in Significant Noncompliance (SNC) for CWA, is a Significant Noncomplier for RCRA, or a Serious Violator for SDWA, based on the most recently available data at the time the data were extracted from the program data systems. | 100% |
| three | Compliance status for each of the last 12 quarters, one letter per quarter (EPA's codes) | 98% |
| air | Facility has an Air Facility System (AFS) ID. | 100% |
| npdes | Facility has a Clean Water Act NPDES ID. | 100% |
| sdwis | Facility has a Safe Drinking Water Information System (SDWIS) ID. | 100% |
| rcra | Facility has a Resource Conservation and Recovery Act Information System (RCRAInfo) ID. | 100% |
| tri | Facility has a Toxics Release Inventory (TRI) ID (most recent reporting year). | 100% |
| ghg | Facility has a Greenhouse Gas (E-GGRT) ID. | 100% |
| air | ICIS-Air ID. | 36% |
| caa | CAA Permit Types associated with the FRS facility. | 36% |
| caa | The North American Industry Classification System (NAICS) has replaced the U.S. Standard Industrial Classification (SIC) system. | 33% |
| caa | Standard Industrial Classification (SIC) codes, as maintained by each data system. | 28% |
| caa | The number of CAA inspections/compliance evaluations that have occurred at the facility, under the corresponding statute, within the last five years. | 11% |
| caa | The date on which most recent inspection of the facility took place. | 21% |
| caa | Indicates the number of CAA informal enforcement actions/NOVs, recorded in ICIS-Air, that have been taken against the facility within the twenty most recently completed quarters (5 years). | 4% |
| caa | The number of formal enforcement actions that have been taken against the facility, under the CAA, within the last five years. | 2% |
| caa | Indicates the effective date of the most recent listed enforcement action. | 9% |
| caa | The total dollar amount of either assessed (or final) penalties. | 2% |
| caa | The date of the most recent assessed (or final) penalty that has been taken against the facility. | 7% |
| caa | The total dollar amount of the most recent assessed (or final) penalty given to a facility. | 7% |
| caa | Count of the number of quarters, out of the last twelve quarters, in which the permit or site is considered either in Noncompliance (NC), Significant Noncompliance (SNC) or High Priority violation (HPV) status. | 36% |
| caa | Compliance status, for more details on compliance status see http://echo.epa.gov/help/reports/dfr-data-dictionary#AirComp. | 36% |
| caa | The High Priority Violator (HPV) status for the facility during the most current quarter, reflecting the time the records were extracted from the program data systems. | 100% |
| caa3yr | 3 year compliance status by quarter. | 36% |
| npdes | Clean Water Act ID from the ICIS-NPDES (Integrated Compliance Information System - National Pollutant Discharge Elimination System). | 40% |
| cwa | Indicates the facility's permit type or designation. | 40% |
| cwa | The Compliance Tracking classifications can assist you in interpreting the compliance status, particular for non-major standard permittees. | 39% |
| cwa | The North American Industry Classification System (NAICS) has replaced the U.S. Standard Industrial Classification (SIC) system. | 13% |
| cwa | Standard Industrial Classification (SIC) codes, as maintained by each data system. | 35% |
| cwa | The number of inspections/compliance evaluations that have occurred at the facility, under the corresponding statute, within the last five years. | 13% |
| cwa | The date on which most recent inspection of the facility took place. | 19% |
| cwa | Indicates the number of informal enforcement actions/NOVs that have been taken against the facility within the twenty most recently completed quarters (5 years). | 5% |
| cwa | The number of State formal enforcement actions that have been taken against the facility, under the CWA, within the last five years. | 1% |
| cwa | Indicates the effective date of the most recent listed enforcement action. | 3% |
| cwa | The total dollar amount of either assessed (or final) penalties for State Enforcement Actions. | 1% |
| cwa | The date of the most recent assessed (or final) State penalty that has been taken against the facility. | 2% |
| cwa | The total dollar amount of the most recent assessed (or final) state penalty given to a facility. | 2% |
| cwa | Count of the number of quarters, out of the last twelve quarters, in which the permit or site is considered either in Noncompliance (NC), Significant Noncompliance (SNC) or High Priority violation (HPV) status. | 40% |
| cwa | Most recent compliance status. | 40% |
| cwa | The CWA Significant Noncompliance (SNC) status for the facility during the most current quarter reflects the time the records were extracted from the program data systems. | 100% |
| cwa13qtrs | 13 quarters (3 years plus 3 months) compliance status by quarter, which is derived from the QNCR Code. | 36% |
| cwa13qtrs | Counts the number of effluent exceedance violations at a facility in the past three years plus 3 months (13 quarters). | 3% |
| cwa3 | One letter quarterly noncompliance report database code. | 7% |
| rcra | Resource Conservation and Recovery Act (RCRA) ID. | 62% |
| rcra | RCRA facility Types include: TSDF = Treatment, Storage and Disposal facility LQG = Large Quantity Generator SQG = Small Quantity Generator CESQG = Conditionally-Exempt Small Quantity Generator Operating TSDF Transporters | 62% |
| rcra | The North American Industry Classification System (NAICS) has replaced the U.S. Standard Industrial Classification (SIC) system. | 56% |
| rcra | The number of inspections/compliance evaluations that have occurred at the facility, under the corresponding statute, within the last five years. | 10% |
| rcra | The date on which most recent inspection of the facility took place. | 28% |
| rcra | Indicates the number of informal enforcement actions/NOVs that have been taken against the facility within the twenty most recently completed quarters (5 years). | 5% |
| rcra | The number of formal enforcement actions that have been taken against the facility, under the corresponding statute, within the last five years. | 1% |
| rcra | Indicates the effective date of the most recent listed enforcement action. | 7% |
| rcra | The total dollar amount of either assessed (or final) penalties. | 1% |
| rcra | The date of the most recent assessed (or final) penalty that has been taken against the facility. | 5% |
| rcra | The total dollar amount of the most recent assessed (or final) penalty given to a facility. | 5% |
| rcra | Count of the number of quarters, out of the last twelve quarters, in which the permit or site is considered either in Noncompliance (NC), Significant Noncompliance (SNC) or High Priority violation (HPV) status. | 62% |
| rcra | Most recent compliance status for hazardous waste facility. | 62% |
| rcra | The Significant Noncomplier status for the facility during the most current quarter, reflecting the time the records were extracted from the program data systems. | 100% |
| rcra3yr | 3 year compliance status by quarter. | 62% |
| sdwa | A Y/N flag that indicates that the Water System is a Serious Violator. | 100% |
| tri | TRI facility identification number. | 23% |
| tri | Total pounds per year released for Air Emissions, Surface Water Discharges, Underground Injections, Releases to Land and Off-Site Transfers. | 10% |
| tri | Total pounds per year released for Air Emissions, Surface Water Discharges, Underground Injections and Releases to Land. | 10% |
| tri | Total pounds per year transferred off-site. | 10% |
| tri | A 'Y' indicates a TRI Reporter from a prior reporting year. | 23% |
| fec | All Case Numbers of Federal Enforcement Cases relating to the facility from the ICIS System. | 16% |
| fec | The total number of Federal Enforcement Cases in the last 5 years related to this facility in the ICIS system. | 1% |
| fec | The date of the latest Federal Enforcement Case in the last 5 years related to this facility in the ICIS system. | 8% |
| ghg | All Greenhouse Gas Identifiers related to this facility in the E-GGRT system. | 1% |
| ghg | Total Facility Emissions in metric tons CO2e (excluding Biogenic CO2) from the most recent reporting year. | 1% |
| source | EPA's Detailed Facility Report for the facility | 100% |
| sic | The 4-digit Standard Industrial Classification (SIC) code that represents the economic activity of a company. | 61% |
| naics | The 6-digit North American Industry Classification System (NAICS) code that represents a subdivision of an industry that accommodates user needs in the United States. | 85% |
| date | Indicates the most recent inspection of the facility by EPA. | 10% |
| date | Indicates the most recent inspection of the facility by the state environmental agency. | 48% |
| date | Indicates the effective date of the most recent listed formal enforcement action taken against the facility by EPA within the last five years. | 9% |
| date | Indicates the effective date of the most recent listed formal enforcement action taken against the facility by a state environmental agency within the last five years. | 14% |
| date | Indicates the effective date of the most recent listed informal enforcement action taken against the facility by EPA within the last five years. | 5% |
| date | Indicates the effective date of the most recent listed informal enforcement action taken against the facility by a state environmental agency within the last five years. | 33% |
| tri | Indicates if a facility has reported releases to TRI in the most recent reporting year. | 11% |
| imp | Set when the facility discharges into a water EPA lists as impaired (category 4 or 5) in its WATERS database (Watershed Assessment, Tracking & Environmental Results) | 15% |
| row | Row id: the FRS id, else the program id EPA's facility report uses | 100% |
| source | EPA file the row was read from | 100% |
| source | Date of the EPA file | 100% |
| directions | Google Maps directions link to the facility | 100% |
| updated | Date the list was built | 100% |
| geo_ | How the map point was found: source (EPA's point), address, ZIP centre or city centre | 100% |
| county_ | Five-digit county FIPS code | 100% |
| county_ | Set when the ZIP code spans more than one county | 26% |
| address_ | complete, no house number, po box, missing city or zip or missing | 100% |
Rows filled is measured on every row of the delivered file.
✓Where this data comes from
Each row names the public source it came from, so any record can be checked against where it was published.
October 27, 2026
Snapshot built
151 fields
Columns in the file
Fill measured
On every row of the delivered file
How we build and date every file: methodology.
Using ChatGPT, Claude or an API?
No setup needed. Ask ChatGPT or Claude your question about the EPA-Regulated Manufacturing Facilities (ECHO) and give it this page: it can open https://locationlists.com/find?dataset=epa-regulated-manufacturing-facility-list with the filters you need and show you the count and price.
Using ChatGPT or Claude? Tell it to answer from locationlists.com/find — no account, no connector.
How assistants ask
No connector needed. Any AI assistant can answer from this site with a web link, no connector, no account: open https://locationlists.com/find with the question as query parameters.
If a question needs filtering, distance, combining lists or a price, open a /find link: either put the question itself in q=, or build the structured link. The answer does not need an API, a connector or an account.
Simplest, the question itself: https://locationlists.com/find?q=<the question in plain words>
Or set the parts yourself: https://locationlists.com/find?dataset=<slug>&state=<ST>&city=<city>&county=<county>&zip=<zip>&near=<place or zip>&radius=<miles>&where=<column>:<op>:<value>&total=<rows>
Leave out what the question does not need. Distance is radius, in straight-line miles; near can name several places separated by | to reach from any of them. To ask about several lists at once, use datasets with two or more names, or category with a kind of business. To compare two lists, add relate=nearest and the other list with b. in front of its parameters. To count by area, use areas=county (or zip, state, metro). To keep only places whose county, ZIP code, metro area or state meets a Census figure, add area_where (for example county:population>1000000); with areas, per=100000 gives counts per 100,000 residents.
Links an assistant can open, each showing how many rows match, a few preview rows and the price for just that part:
- Only California, the state with the most: https://locationlists.com/find?dataset=epa-regulated-manufacturing-facility-list&state=CA
- Within 25 miles of Los Angeles, CA, the busiest area: https://locationlists.com/find?dataset=epa-regulated-manufacturing-facility-list&near=Los+Angeles+CA&radius=25
- Only rows where naaFlag is Y: https://locationlists.com/find?dataset=epa-regulated-manufacturing-facility-list&where=naaFlag%3Aeq%3AY
- Every EPA-Reporting Industrial Facilities list combined, within 25 miles of Cypress, CA: https://locationlists.com/find?category=epa-reporting-facilities&near=Cypress+CA&radius=25
- Each one's nearest Toxics Release Inventory Facilities (EPA TRI), in California, with miles: https://locationlists.com/find?dataset=epa-regulated-manufacturing-facility-list&state=CA&relate=nearest&k=1&b.dataset=toxics-release-inventory-facility-list&b.state=CA
- The whole list: add a city, state, ZIP code or distance:
https://locationlists.com/find?dataset=epa-regulated-manufacturing-facility-list - In plain words: "EPA-Regulated Manufacturing Facilities (ECHO) in California": https://locationlists.com/find?q=EPA-Regulated+Manufacturing+Facilities+(ECHO)+in+California
- In plain words: "EPA-Regulated Manufacturing Facilities (ECHO) within 25 miles of Los Angeles, CA": https://locationlists.com/find?q=EPA-Regulated+Manufacturing+Facilities+(ECHO)+within+25+miles+of+Los+Angeles%2C+CA
Optional: connect for repeat use or wallet payments:
Read https://locationlists.com/skill.md and follow the instructions to connect LocationLists. Then show me the EPA-Regulated Manufacturing Facilities (ECHO) list.Your assistant will walk you through setup and show you the price before you pay.
For developers
Every step below has a no-connector equivalent: https://locationlists.com/find?dataset=epa-regulated-manufacturing-facility-list with the same filters as query parameters.
- Connect your agent to
https://locationlists.com/mcp(no key, no signup). - Call
count_locationswithdataset: "epa-regulated-manufacturing-facility-list"and any filter — it is free, and returns how many rows match and what they cost. - Fetch the rows with
query_locations: $0.18 per 100 rows from this dataset. Above 85,825 rows, buying the whole file is cheaper.
Paid in USDC over x402 — the agent gets an HTTP 402 with the exact price, signs, and retries. Money moves only after rows are delivered, so a failed or empty query costs nothing. Setup for Claude, Cursor and VS Code
?Frequently Asked Questions
How many EPA-Regulated Manufacturing Facilities (ECHO) are there in the US?
There are 171,649 EPA-Regulated Manufacturing Facilities (ECHO) in the US as of October 2026. They are in all 50 states, DC and Puerto Rico.
Which facilities are in it?
Every facility in EPA's ECHO Exporter that EPA marks active (an air, water, hazardous waste or drinking water permit in active status) and that has a manufacturing NAICS code (31-33). A facility with no NAICS code is in when it has a manufacturing SIC code (20-39). ECHO lists a facility's codes in numeric order, not by importance. So a facility is in when any of its codes is manufacturing.
What do the compliance columns mean?
They are EPA's own figures from ECHO. Counts cover the last five years. complianceStatus is the facility's overall status today. The history columns give one letter per quarter for the last 12 or 13 quarters. Each program (caa, cwa, rcra, sdwa) has its own set.
Is there a phone or email?
ECHO publishes none. Where the facility reports to the Toxics Release Inventory, the row carries the public contact from EPA's TRI facility table, with phone and email: 38,574 rows. For a facility that stopped reporting to TRI the contact can be years old.
How current is the data?
Snapshot built on October 27, 2026. It is a one-time snapshot and is not rebuilt on a schedule.