Greenhouse Gas Reporting Facilities (EPA GHGRP)
U.S. · 8,091 locations
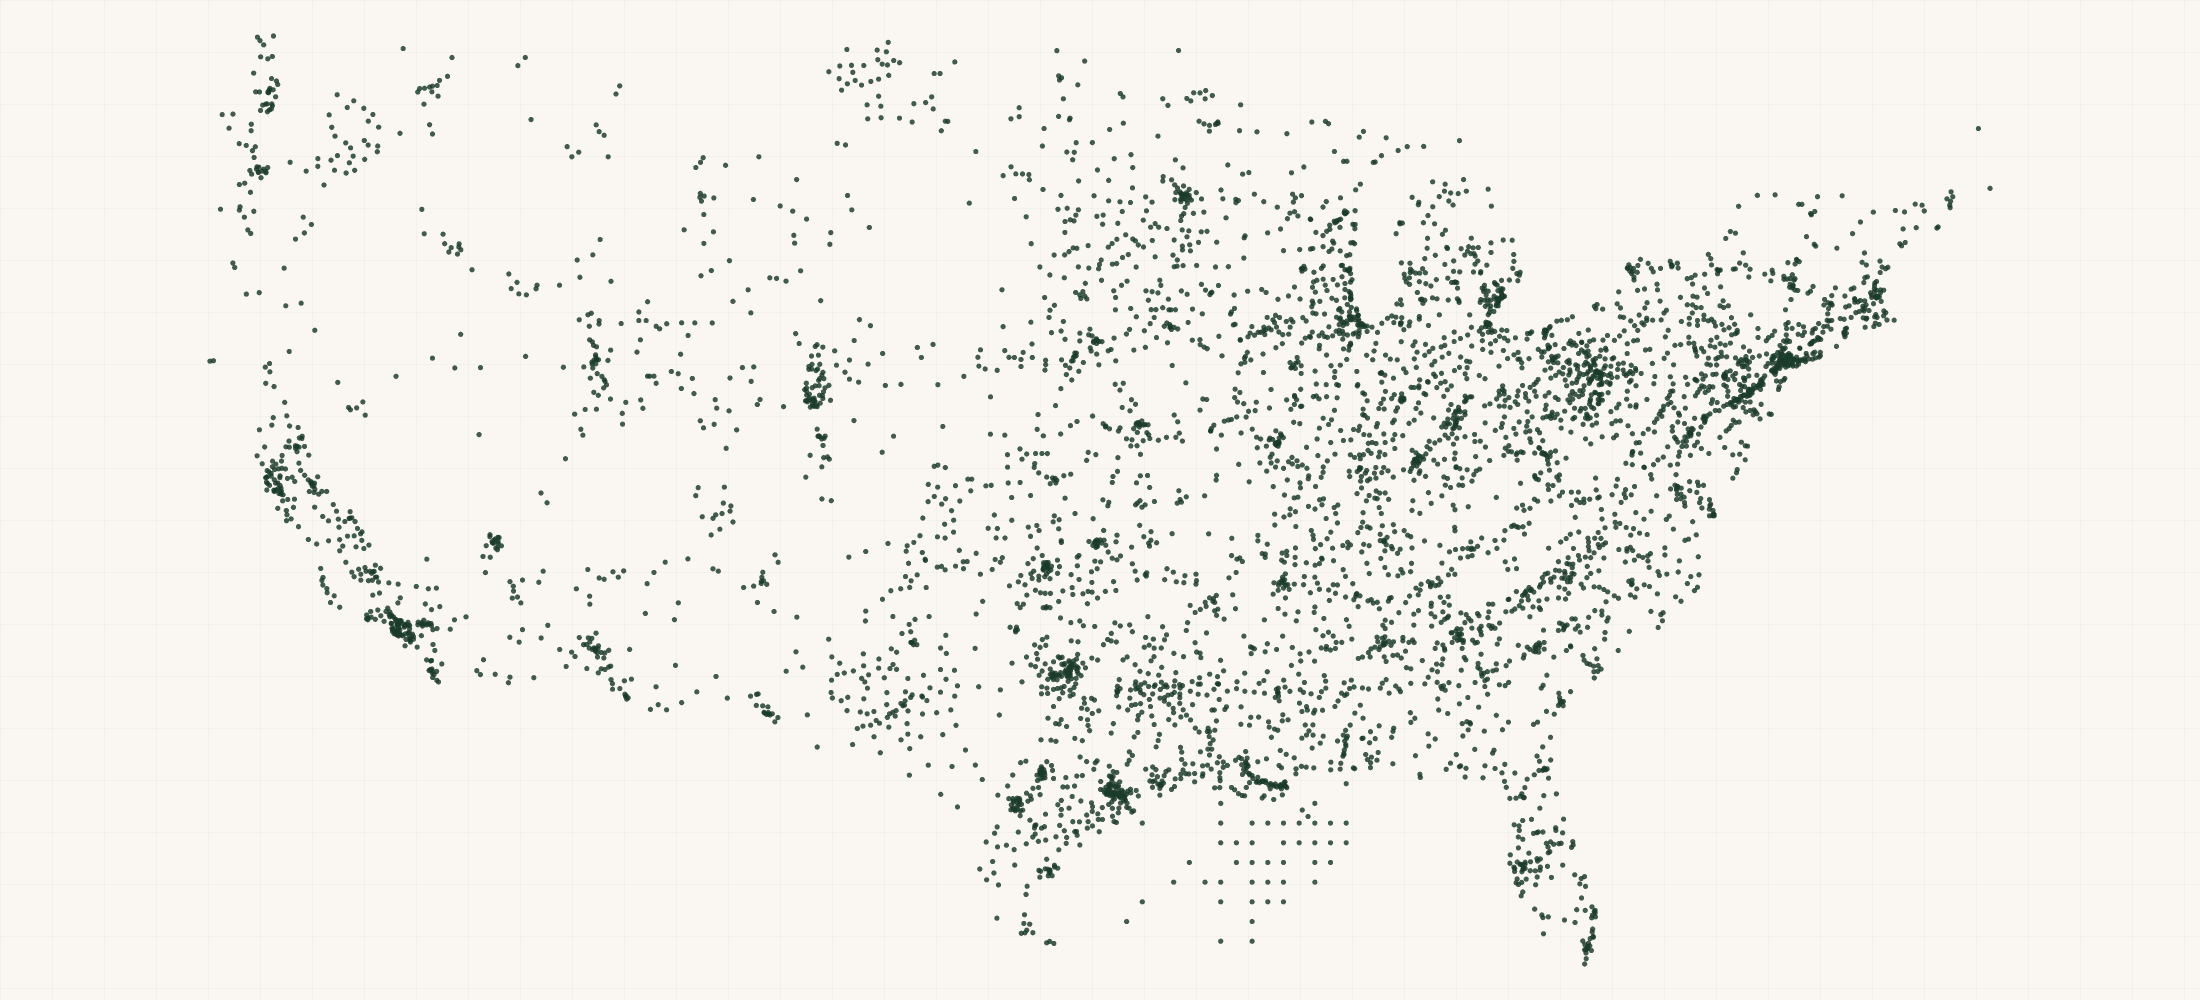
There are 8,091 Greenhouse Gas Reporting Facilities (EPA GHGRP) in the US as of October 2026. They are in all 50 states, DC and Puerto Rico.
8,091 facilities that reported to EPA's Greenhouse Gas Reporting Program for 2023, read on 26 October 2026 from EPA's GHGRP workbooks, its parent company file and its facility table.
More about this list
Facilities that emit 25,000 metric tons CO2e or more a year report, and so do suppliers of fuels and industrial gases. 7,527 report direct emissions and 1,004 are suppliers. Waste has 1,434 facilities, Power Plants 1,303 and Petroleum and Natural Gas Systems 1,186. 633 emit a million tons or more. Each row sums every GHGRP sheet the facility reports on that year. It gives emissions by gas and by process, and the change from 2022. Direct emissions by year go back to 2011. Each row has the facility's national and state rank. It names every parent company with its percent ownership and address. Direct emissions add up to 2.58 billion metric tons CO2e.
Need just some of them? Ask in your own words.
●Where the rows are
≡Sample Data Preview
| name | address | city | state | zip | parent company | parent ownership pct | parent address | parent city | parent state | parent zip | parent count | parent companies | county | basin | state name | naics code | facility types | industry sectors | is direct emitter | is supplier | injects co2 | subparts reported | subpart count | reporting sheets | section232 sector | reporting year | direct emissions tco2e | total reported tco2e | methane share pct | co2 tco2e | methane tco2e | nitrous oxide tco2e | hfc tco2e | pfc tco2e | sf6 tco2e | nf3 tco2e | other fluorinated tco2e | hfe tco2e | very short lived tco2e | other ghg tco2e | biogenic co2 tco2e | largest source | largest source tco2e | largest source share pct | emissions by source | supplied ghg tco2e | co2 received for injection T | co2 sequestered T | prior year | prior year direct tco2e | change vs prior year tco2e | change vs prior year pct | prior year biogenic co2 tco2e | prior year supplied ghg tco2e | prior year total reported tco2e | first trend year | first trend year tco2e | change since first year pct | annual growth rate pct | direct emissions by year | trend year count | national rank | state rank | facilities in state | state share pct | national share pct | continuous monitoring | co2 captured | emitted co2 supplied | emission classification | tribal land id | mrv plan url | first year reported | years reported | ghgrp facility id | frs id | eggrt facility id | source file | source date | row id | directions url | updated date | geo precision | county fips | county note | address quality | country | latitude | longitude | source url |
|---|---|---|---|---|---|---|---|---|---|---|---|---|---|---|---|---|---|---|---|---|---|---|---|---|---|---|---|---|---|---|---|---|---|---|---|---|---|---|---|---|---|---|---|---|---|---|---|---|---|---|---|---|---|---|---|---|---|---|---|---|---|---|---|---|---|---|---|---|---|---|---|---|---|---|---|---|---|---|---|---|---|---|---|---|---|---|---|---|---|---|
| Akutan Seafood Processing Facility | 73 Salmon Way | Akutan | AK | 99553 | Trident Seafoods Corp | 100 | 5303 Shilshole Ave Nw | Seattle | WA | 98107 | 1 | Trident Seafoods Corp (100%) | Aleutians East Borough | Alaska | 311710 | Direct Emitter | Other | Y | N | N | C | 1 | Direct Point Emitters | 2023 | 46061 | 46061 | 0.1 | 45888 | 53 | 120 | 0 | 0 | 0 | 0 | 0 | 0 | 0 | 0 | 699 | Stationary Combustion | 46061 | 100.0 | Stationary Combustion: 46061 | 0 | 0 | 0 | 2022 | 44363 | 1698 | 3.8 | 778 | 0 | 44363 | 2011 | 43930 | 4.9 | 0.4 | 2011: 43930; 2012: 50748; 2013: 52319; 2014: 52025; 2015: 50712; 2016: 52175; 2017: 49049; 2018: 49750; 2019: 47921; 2020: 50186; 2021: 46017; 2022: 44363; 2023: 46061 | 13 | 4673 | 42 | 75 | 0.24 | 0.002 | N | CU_ONLY | 2010 | 14 | 1010624 | 549298 | https://www.epa.gov/ghgreporting/data-sets | 2026-10-26 | 1010624 | https://www.google.com/maps/dir/?api=1&destination=54.132189%2C-165.786894 | 2026-10-26 | source | 02013 | complete | US | 54.132189 | -165.786894 | https://data.epa.gov/efservice/pub_dim_facility/facility_id/=/1010624/year/=/2023/JSON | ||||||||
| VMC Specialty Alloys LLC | 800 Martin Luther King Jr Drive | Adairsville | GA | 30103 | VMC Specialty Alloys LLC | 100 | 800 Martin Luther King Drive | Adairsville | GA | 30103 | 1 | VMC Specialty Alloys LLC (100%) | Bartow County | Georgia | 331314 | Direct Emitter | Metals | Y | N | N | C | 1 | Direct Point Emitters | aluminum | 2023 | 38972 | 38972 | 0.0 | 38932 | 18 | 22 | 0 | 0 | 0 | 0 | 0 | 0 | 0 | 0 | 0 | Stationary Combustion | 38972 | 100.0 | Stationary Combustion: 38972 | 0 | 0 | 0 | 2022 | 38315 | 657 | 1.7 | 0 | 0 | 38315 | 2022 | 38315 | 1.7 | 1.7 | 2022: 38315; 2023: 38972 | 2 | 5105 | 114 | 204 | 0.07 | 0.002 | N | CU_ONLY | 2022 | 2 | 1015119 | 110057451831 | 589141 | https://www.epa.gov/ghgreporting/data-sets | 2026-10-26 | 1015119 | https://www.google.com/maps/dir/?api=1&destination=34.367138%2C-84.906764 | 2026-10-26 | source | 13015 | ZIP 30103 spans 3 counties; assigned to the county holding 69% of its land area | complete | US | 34.367138 | -84.906764 | https://data.epa.gov/efservice/pub_dim_facility/facility_id/=/1015119/year/=/2023/JSON | |||||
| Accident Station | 196 Texas Eastern Drive | Accident | MD | 21520 | Enbridge (US) Inc | 100 | 915 North Eldridge Parkway | Houston | TX | 77079 | 1 | Enbridge (US) Inc (100%) | Garrett County | Maryland | 486210 | Direct Emitter | Petroleum and Natural Gas Systems | Y | N | N | C,W | 2 | Direct Point Emitters | 2023 | 24516 | 24516 | 17.3 | 20272 | 4234 | 11 | 0 | 0 | 0 | 0 | 0 | 0 | 0 | 0 | 0 | Stationary Combustion | 20287 | 82.7 | Stationary Combustion: 20287; Petroleum and Natural Gas Systems – Underground Storage: 4229 | 0 | 0 | 0 | 2022 | 26428 | -1912 | -7.2 | 0 | 0 | 26428 | 2011 | 48676 | -49.6 | -5.6 | 2011: 48676; 2012: 19277; 2013: 23114; 2014: 23567; 2015: 22735; 2016: 20734; 2017: 26376; 2018: 27725; 2019: 19969; 2020: 24030; 2021: 22645; 2022: 26428; 2023: 24516 | 13 | 6302 | 47 | 60 | 0.17 | 0.001 | N | CU_OTHERS | 2011 | 13 | 1008234 | 110071161115 | 538110 | https://www.epa.gov/ghgreporting/data-sets | 2026-10-26 | 1008234 | https://www.google.com/maps/dir/?api=1&destination=39.633667%2C-79.340479 | 2026-10-26 | source | 24023 | complete | US | 39.633667 | -79.340479 | https://data.epa.gov/efservice/pub_dim_facility/facility_id/=/1008234/year/=/2023/JSON | |||||||
| SALEM COUNTY IMPROVEMENT AUTHORITY LANDFILL | 52 Mckillip Rd | Alloway | NJ | 08001 | Salem County Improvement Authority | 100 | 286 WELCHVILLE ROAD | ALLOWAY | NJ | 08001 | 1 | Salem County Improvement Authority (100%) | Salem County | New Jersey | 562212 | Direct Emitter | Waste | Y | N | N | C,HH | 2 | Direct Point Emitters | 2023 | 56844 | 56844 | 100.0 | 14 | 56830 | 0 | 0 | 0 | 0 | 0 | 0 | 0 | 0 | 0 | 0 | Municipal Landfills | 56830 | 100.0 | Municipal Landfills: 56830; Stationary Combustion: 14 | 0 | 0 | 0 | 2022 | 60400 | -3556 | -5.9 | 0 | 0 | 60400 | 2011 | 93253 | -39.0 | -4.0 | 2011: 93253; 2012: 42682; 2013: 73233; 2014: 92800; 2015: 203960; 2016: 81682; 2017: 100092; 2018: 81143; 2019: 83669; 2020: 95760; 2021: 63577; 2022: 60400; 2023: 56844 | 13 | 4147 | 34 | 101 | 0.29 | 0.002 | N | CU_OTHERS | 2010 | 14 | 1007261 | 110001545855 | 536717 | https://www.epa.gov/ghgreporting/data-sets | 2026-10-26 | 1007261 | https://www.google.com/maps/dir/?api=1&destination=39.5879%2C-75.3697 | 2026-10-26 | source | 34033 | complete | US | 39.5879 | -75.3697 | https://data.epa.gov/efservice/pub_dim_facility/facility_id/=/1007261/year/=/2023/JSON | |||||||
| Aberdeen Generating Station | 421 30th Ave SW | Aberdeen | SD | 57401 | Northwestern Corp | 100 | 3010 W 69Th Street | Sioux Falls | SD | 57108 | 1 | Northwestern Corp (100%) | Brown County | South Dakota | 221112 | Direct Emitter | Power Plants | Y | N | N | C,D | 2 | Direct Point Emitters | 2023 | 22998 | 22998 | 0.0 | 22975 | 10 | 13 | 0 | 0 | 0 | 0 | 0 | 0 | 0 | 0 | 0 | Electricity Generation | 22908 | 99.6 | Electricity Generation: 22908; Stationary Combustion: 90 | 0 | 0 | 0 | 2022 | 36536 | -13537 | -37.1 | 0 | 0 | 36536 | 2012 | 3245 | 608.6 | 19.5 | 2012: 3245; 2013: 10038; 2014: 3133; 2015: 5210; 2016: 3093; 2017: 7644; 2018: 23955; 2019: 32094; 2020: 19779; 2021: 36817; 2022: 36536; 2023: 22998 | 12 | 6427 | 35 | 40 | 0.37 | 0.001 | N | CU_OTHERS | 2012 | 12 | 1010630 | 549258 | https://www.epa.gov/ghgreporting/data-sets | 2026-10-26 | 1010630 | https://www.google.com/maps/dir/?api=1&destination=45.45807%2C-98.50242 | 2026-10-26 | source | 46013 | complete | US | 45.45807 | -98.50242 | https://data.epa.gov/efservice/pub_dim_facility/facility_id/=/1010630/year/=/2023/JSON |
{}What's in each row
| Field | What it is | Rows filled |
|---|---|---|
| name | Facility name as reported to EPA (all-capitals names set in title case) | 100% |
| parent | Parent company with the largest ownership share | 100% |
| parent | Parent company's percent ownership of the facility | 99% |
| parent | Parent company's street address | 99% |
| parent | Parent company's city | 99% |
| parent | Parent company's state | 99% |
| parent | Parent company's ZIP code | 99% |
| parent | How many parent companies the facility names | 100% |
| parent | Every parent company with its percent ownership | 100% |
| address | Street address of the facility | 94% |
| city | City | 100% |
| state | Two-letter state code | 100% |
| zip | Five-digit ZIP code | 100% |
| county | County name | 99% |
| country | Country (US) | 100% |
| latitude | Latitude EPA publishes for the facility | 100% |
| longitude | Longitude EPA publishes for the facility | 100% |
| basin | Oil and gas basin, for onshore production and gathering reporters (reported by basin, not by street) | 10% |
| state | State name | 100% |
| naics | Primary NAICS code the facility reports | 100% |
| facility | EPA facility types: Direct Emitter, Supplier, Onshore Oil & Gas Production and others | 100% |
| industry | GHGRP industry sectors (Power Plants, Waste, Petroleum and Natural Gas Systems, Chemicals, Metals and others) | 100% |
| is | Y when the facility reports direct emissions | 100% |
| is | Y when the facility supplies fuels or industrial gases | 100% |
| injects | Y when the facility reports CO2 injection or geologic sequestration | 100% |
| subparts | GHGRP subparts the facility reports under (letters, e.g. C, D, AA) | 100% |
| subpart | How many subparts the facility reports under | 100% |
| reporting | Which GHGRP data sheets the facility appears on that year | 100% |
| section232 | Section 232 investigation the facility's NAICS code falls under (steel, aluminum, copper, timber and lumber, autos and parts and others); blank when none | 7% |
| reporting | Latest year the facility reported for | 100% |
| direct | Total reported direct emissions, metric tons CO2e (every sheet summed) | 100% |
| total | Direct emissions plus the GHG quantity of fuels and gases supplied, metric tons CO2e | 100% |
| methane | Methane's share of direct emissions, in percent | 93% |
| co2 | CO2 (non-biogenic), metric tons | 100% |
| methane | Methane, metric tons CO2e | 100% |
| nitrous | Nitrous oxide, metric tons CO2e | 100% |
| hfc | HFCs, metric tons CO2e | 100% |
| pfc | PFCs, metric tons CO2e | 100% |
| sf6 | SF6, metric tons CO2e | 100% |
| nf3 | NF3, metric tons CO2e | 100% |
| other | Other fully fluorinated GHGs, metric tons CO2e | 100% |
| hfe | HFEs, metric tons CO2e | 100% |
| very | Very short-lived compounds, metric tons CO2e | 100% |
| other | Other GHGs, metric tons CO2e | 100% |
| biogenic | Biogenic CO2, metric tons (not in the direct total) | 100% |
| largest | Process with the largest emissions (Electricity Generation, Stationary Combustion, Cement Production and others) | 80% |
| largest | Emissions from the largest process, metric tons CO2e | 80% |
| largest | Largest process's share of direct emissions, in percent | 80% |
| emissions | Emissions by process, metric tons CO2e | 80% |
| supplied | GHG quantity of the natural gas, NGLs, CO2, coal liquids and petroleum products supplied, metric tons CO2e | 100% |
| co2 | CO2 received for injection, metric tons | 100% |
| co2 | CO2 sequestered underground, metric tons | 100% |
| prior | The year before the reporting year | 100% |
| prior | Direct emissions the year before, metric tons CO2e | 79% |
| change | Change in direct emissions from the year before, metric tons CO2e | 79% |
| change | Change in direct emissions from the year before, in percent | 79% |
| prior | Biogenic CO2 the year before, metric tons | 98% |
| prior | GHG quantity supplied the year before, metric tons CO2e | 98% |
| prior | Direct plus supplied the year before, metric tons CO2e | 98% |
| first | First year in EPA's emissions-by-year file for the facility (2011 at the earliest) | 80% |
| first | Direct emissions in that first year, metric tons CO2e | 80% |
| change | Change in direct emissions since that first year, in percent | 80% |
| annual | Compound annual change in direct emissions since that first year, in percent | 79% |
| direct | Direct emissions for every year in EPA's by-year file, metric tons CO2e | 80% |
| trend | How many years have a direct emissions figure | 100% |
| national | Rank by direct emissions among all reporting facilities (1 = largest) | 93% |
| state | Rank by direct emissions within the state | 93% |
| facilities | Reporting facilities in the state | 100% |
| state | Share of the state's reported direct emissions, in percent | 93% |
| national | Share of all reported direct emissions, in percent | 93% |
| continuous | Y when the facility uses continuous emissions monitoring | 82% |
| emission | EPA's emission classification code | 100% |
| tribal | Tribal land id, for a facility on tribal land | 2% |
| first | First year the facility reported to the program | 100% |
| years | How many years the facility has reported | 100% |
| ghgrp | GHGRP facility id | 100% |
| frs | EPA Facility Registry Service id (links the facility across EPA programs) | 88% |
| eggrt | e-GGRT facility id (EPA's reporting system) | 100% |
| source | EPA's public record for the facility | 100% |
| source | EPA file the row was read from | 100% |
| source | Date the EPA files were read | 100% |
| row | Row id: the program's own facility id | 100% |
| directions | Google Maps directions link to the facility | 100% |
| updated | Date the list was built | 100% |
| geo_ | How the map point was found: source (EPA's point), address, ZIP centre or city centre | 100% |
| county_ | Five-digit county FIPS code | 99% |
| county_ | Set when the ZIP code spans more than one county | 31% |
| address_ | complete, no house number, po box, missing city or zip or missing | 100% |
Rows filled is measured on every row of the delivered file.
✓Where this data comes from
Each row names the public source it came from, so any record can be checked against where it was published.
October 26, 2026
Snapshot built
91 fields
Columns in the file
Fill measured
On every row of the delivered file
How we build and date every file: methodology.
Using ChatGPT, Claude or an API?
No setup needed. Ask ChatGPT or Claude your question about the Greenhouse Gas Reporting Facilities (EPA GHGRP) and give it this page: it can open https://locationlists.com/find?dataset=epa-greenhouse-gas-reporting-facility-list with the filters you need and show you the count and price.
Using ChatGPT or Claude? Tell it to answer from locationlists.com/find — no account, no connector.
How assistants ask
No connector needed. Any AI assistant can answer from this site with a web link, no connector, no account: open https://locationlists.com/find with the question as query parameters.
If a question needs filtering, distance, combining lists or a price, open a /find link: either put the question itself in q=, or build the structured link. The answer does not need an API, a connector or an account.
Simplest, the question itself: https://locationlists.com/find?q=<the question in plain words>
Or set the parts yourself: https://locationlists.com/find?dataset=<slug>&state=<ST>&city=<city>&county=<county>&zip=<zip>&near=<place or zip>&radius=<miles>&where=<column>:<op>:<value>&total=<rows>
Leave out what the question does not need. Distance is radius, in straight-line miles; near can name several places separated by | to reach from any of them. To ask about several lists at once, use datasets with two or more names, or category with a kind of business. To compare two lists, add relate=nearest and the other list with b. in front of its parameters. To count by area, use areas=county (or zip, state, metro). To keep only places whose county, ZIP code, metro area or state meets a Census figure, add area_where (for example county:population>1000000); with areas, per=100000 gives counts per 100,000 residents.
Links an assistant can open, each showing how many rows match, a few preview rows and the price for just that part:
- Only Texas, the state with the most: https://locationlists.com/find?dataset=epa-greenhouse-gas-reporting-facility-list&state=TX
- Within 25 miles of Houston, TX, the busiest area: https://locationlists.com/find?dataset=epa-greenhouse-gas-reporting-facility-list&near=Houston+TX&radius=25
- Only rows where isDirectEmitter is Y: https://locationlists.com/find?dataset=epa-greenhouse-gas-reporting-facility-list&where=isDirectEmitter%3Aeq%3AY
- Every EPA-Reporting Industrial Facilities list combined, within 25 miles of West University Place, TX: https://locationlists.com/find?category=epa-reporting-facilities&near=West+University+Place+TX&radius=25
- Each one's nearest Toxics Release Inventory Facilities (EPA TRI), in Texas, with miles: https://locationlists.com/find?dataset=epa-greenhouse-gas-reporting-facility-list&state=TX&relate=nearest&k=1&b.dataset=toxics-release-inventory-facility-list&b.state=TX
- The whole list: add a city, state, ZIP code or distance:
https://locationlists.com/find?dataset=epa-greenhouse-gas-reporting-facility-list - In plain words: "Greenhouse Gas Reporting Facilities (EPA GHGRP) in Texas": https://locationlists.com/find?q=Greenhouse+Gas+Reporting+Facilities+(EPA+GHGRP)+in+Texas
- In plain words: "Greenhouse Gas Reporting Facilities (EPA GHGRP) within 25 miles of Houston, TX": https://locationlists.com/find?q=Greenhouse+Gas+Reporting+Facilities+(EPA+GHGRP)+within+25+miles+of+Houston%2C+TX
Optional: connect for repeat use or wallet payments:
Read https://locationlists.com/skill.md and follow the instructions to connect LocationLists. Then show me the Greenhouse Gas Reporting Facilities (EPA GHGRP) list.Your assistant will walk you through setup and show you the price before you pay.
For developers
Every step below has a no-connector equivalent: https://locationlists.com/find?dataset=epa-greenhouse-gas-reporting-facility-list with the same filters as query parameters.
- Connect your agent to
https://locationlists.com/mcp(no key, no signup). - Call
count_locationswithdataset: "epa-greenhouse-gas-reporting-facility-list"and any filter — it is free, and returns how many rows match and what they cost. - Fetch the rows with
query_locations: $0.97 per 100 rows from this dataset. Above 4,046 rows, buying the whole file is cheaper.
Paid in USDC over x402 — the agent gets an HTTP 402 with the exact price, signs, and retries. Money moves only after rows are delivered, so a failed or empty query costs nothing. Setup for Claude, Cursor and VS Code
?Frequently Asked Questions
How many Greenhouse Gas Reporting Facilities (EPA GHGRP) are there in the US?
There are 8,091 Greenhouse Gas Reporting Facilities (EPA GHGRP) in the US as of October 2026. They are in all 50 states, DC and Puerto Rico.
Which facilities are in it?
Every facility that reported to the GHGRP for 2023, the latest year EPA has published, as of 26 October 2026. Facilities that stopped reporting before 2023 are not in this list.
What does one row cover?
One GHGRP facility id. Some facilities report on two or three sheets, for example a plant that is a direct emitter and also supplies natural gas. The row sums them, and reportingSheets names the sheets.
Who owns each facility?
parentCompany is the parent with the largest share in EPA's 2023 parent company file, with its percent and address. parentCompanies lists every parent with its percent. 472 facilities name more than one parent.
Why do some rows have no street?
Onshore oil and gas production and gathering reporters report by basin, not by site. 526 rows have no street address, and the basin column names the basin.