School Districts in North Carolina
U.S. · 376 locations
There are 376 School Districts in North Carolina as of September 2026.
Every school district in North Carolina — 376 local education agencies from the federal district collection, with the district office address, phone, website and map coordinates, the number of schools, enrolment, grade range, teacher and administrator counts, county and metro area, and the full finance block: revenue and spending lines, per-pupil spending, Title I, Impact Aid, special-education student counts and E-Rate commitments where they can be matched.
More about this list
No contact names. One row is one local education agency, located at its administrative office — 376 of them, a cut of the national file limited to North Carolina. It is built from the federal Common Core of Data, the NCES EDGE district-office geocode, the Census/NCES F-33 school district finance survey, the Department of Education's IDEA Section 618 special-education counts, and USAC's published E-Rate commitments. US federal government data, public domain. Nothing in it was bought, licensed or taken from another company's product. Measured on every row of this file: a street address on 100.0%, a phone number on 100.0%, a website on 68.8%, map coordinates on 100.0%, the number of schools on 100.0%, enrolment on 89.3%. 209 columns in all, and the page lists the fill rate for each one. On the record: we compare every file to the fullest published competitor list before selling it and require 80.0% of their fields. This one measures 79.1% against MCH Strategic Data — School District dictionary, 163 fields (151 institution + 12 person), read on mchdata.com 2026-09-15. QUOTE-ONLY: MCH publishes no price, so there is no 20% anchor, only a field bar. and is short by 2 fields, so it was released by an explicit decision rather than by passing the bar. 28 of 163 MCH fields are not federally published for any LEA — 16 Calendar Dates and the 12 named-person fields. The ceiling against this dictionary is therefore 82.8%, not 100%. Of the fields that can be obtained at all, this file has 95.6%.
Need just some of them? Ask in your own words.
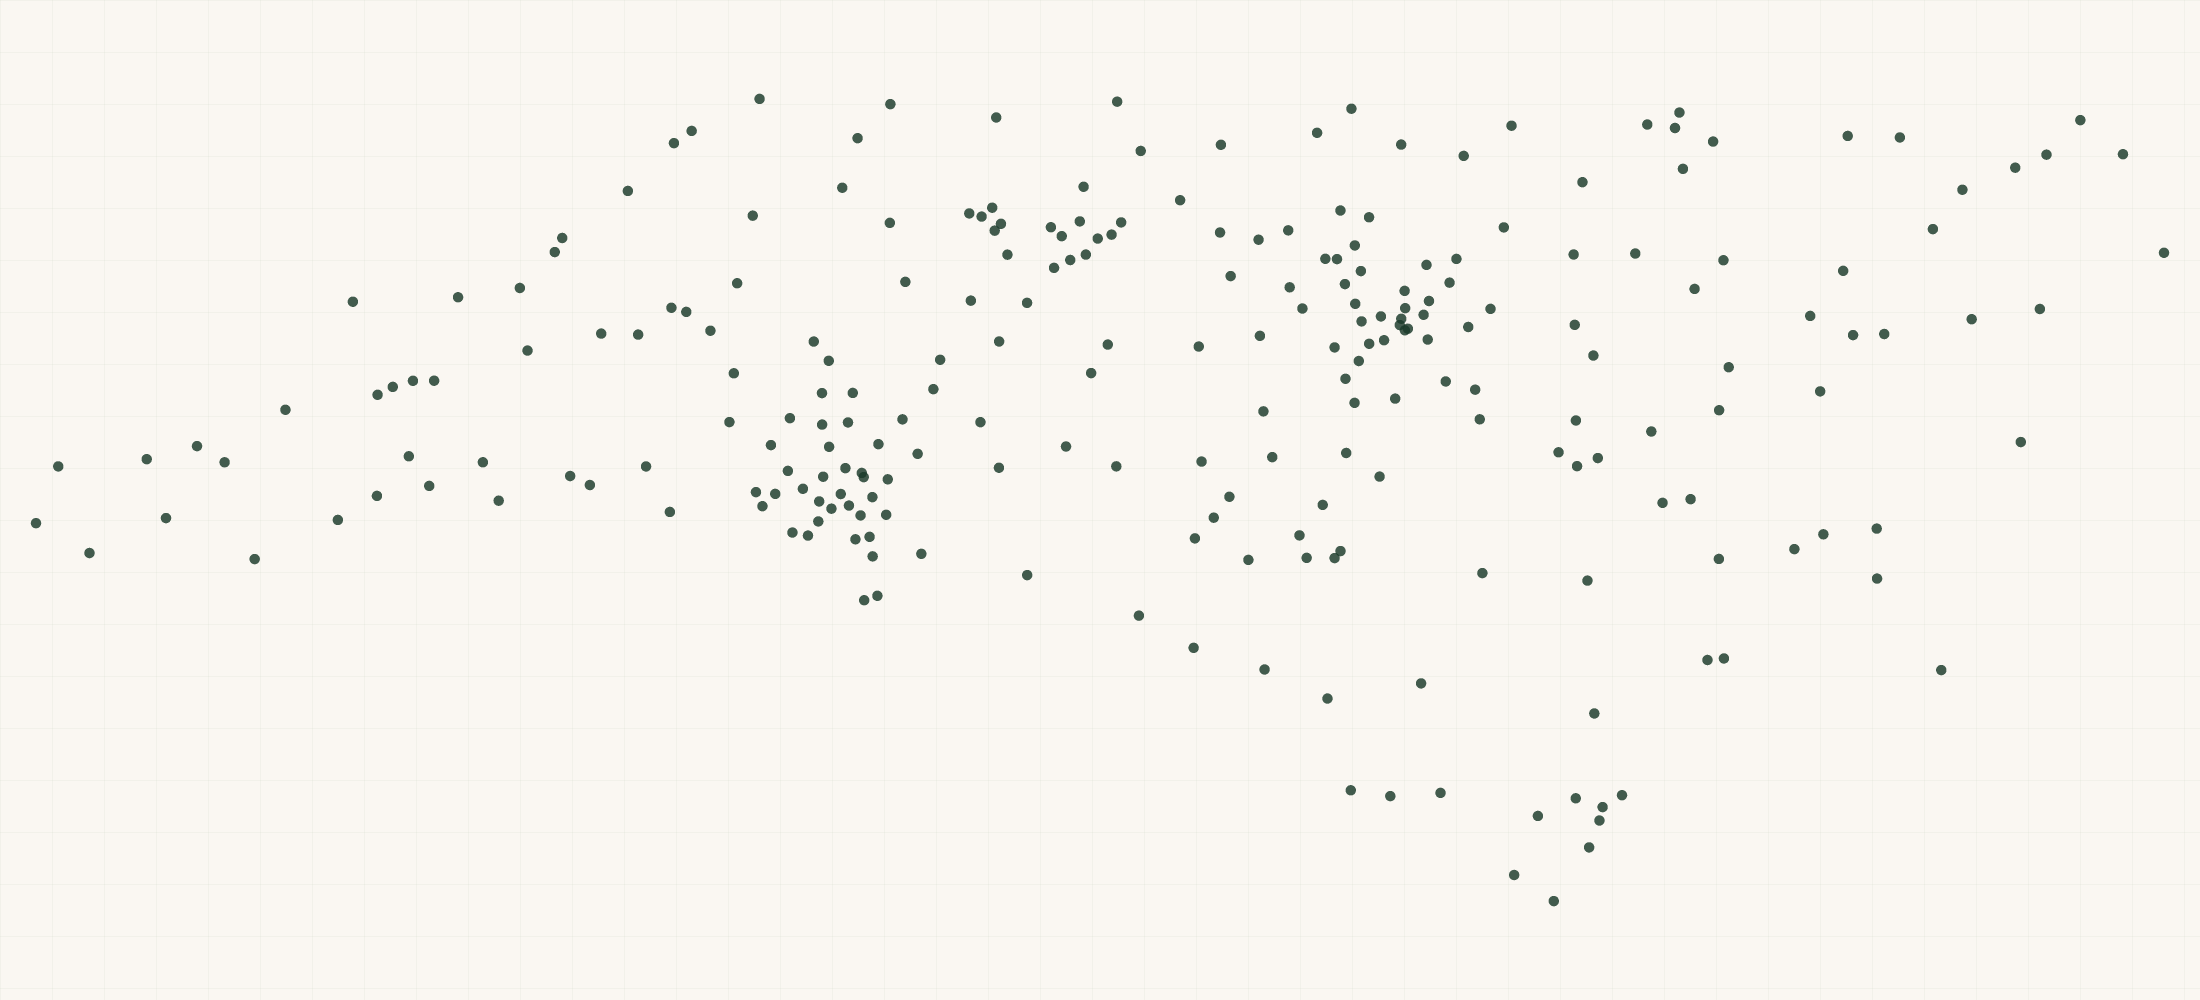
●Where the rows are
≡Sample Data Preview
| name | address | city | state | zip | phone | website | lea id | state lea id | school type | agency type | agency type text | agency level | agency charter indicator | operational status | operational status date | address2 | zip4 | state name | state fips | census region | census division | school year | state agency number | mailing address | mailing city | mailing state | mailing zip | mailing zip4 | county | county fips | locale | locale text | school level code | school level text | grades offered | updated status | cbsa | cbsa name | cbsa type | csa | csa name | congressional district | state leg district lower | state leg district upper | supervisory union number | affiliation | bureau indian education | out of state flag | number of schools | grade range | lowest grade offered | highest grade offered | enrollment | reference year | enrollment pre K | enrollment kindergarten | enrollment elementary | enrollment high school | enrollment ungraded | enrollment adult ed | enrollment grade1 | enrollment grade2 | enrollment grade3 | enrollment grade4 | enrollment grade5 | enrollment grade6 | enrollment grade7 | enrollment grade8 | enrollment grade9 | enrollment grade10 | enrollment grade11 | enrollment grade12 | enrollment grade13 | enrollment male | enrollment female | students american indian | pct students american indian | students asian | pct students asian | students black | pct students black | students hispanic | pct students hispanic | students pacific islander | pct students pacific islander | students two or more | pct students two or more | students white | pct students white | teachers total fte | teachers prek fte | teachers kindergarten fte | teachers elementary fte | teachers secondary fte | teachers ungraded fte | guidance counselors total fte | guidance counselors elem fte | guidance counselors sec fte | school counselors fte | school psychologists fte | librarian specialists fte | librarian support staff fte | lea administrators fte | lea admin support staff fte | school administrators fte | school admin support staff fte | instructional aides fte | instructional coordinators fte | student support staff fte | other support staff fte | other staff fte | lea staff total fte | school staff total fte | staff total fte | teachers | student teacher ratio | rev total | rev federal total | rev state total | rev local total | rev fed title I | rev fed idea | rev fed career tech | rev fed supporting effective instruction | rev fed student support | rev fed21st century learning | rev fed rural low income | rev fed bilingual education | rev fed child nutrition | rev fed other thru state | rev fed impact aid | rev fed indian education | rev fed small rural achievement | rev fed other direct | rev state general formula | rev state special education | rev state compensatory | rev state career tech | rev state school meals | rev state capital outlay | rev state transportation | rev state other programs | rev local property taxes | rev local parent government | rev local sales taxes | rev local from other school systems | rev local from cities counties | rev local tuition fees | rev local school meals | rev local interest earnings | exp total | exp current elsec | exp instruction | exp support services | exp other current elsec | exp capital outlay | exp non elsec | exp support students | exp support instructional staff | exp support general admin | exp support school admin | exp operation maintenance | exp student transportation | exp food services | exp construction | exp instructional equipment | exp other equipment | exp salaries total | exp salaries instruction | exp employee benefits total | exp interest on debt | exp payments to charter schools | finance fiscal year | finance fall membership | per pupil current spending | per pupil instruction | per pupil support services | per pupil total revenue | impact aid revenue | receives impact aid | erate funding year | erate commitments | erate funding requests | erate commitments3yr | erate funding requests3yr | idea part bstudents | idea part bearly childhood | idea part bschool age | idea child count year | locale share city11 | locale share city12 | locale share city13 | locale share sub21 | locale share sub22 | locale share sub23 | locale share town31 | locale share town32 | locale share town33 | locale share rural41 | locale share rural42 | locale share rural43 | geo precision | county fips | address quality | country | latitude | longitude | source url |
|---|---|---|---|---|---|---|---|---|---|---|---|---|---|---|---|---|---|---|---|---|---|---|---|---|---|---|---|---|---|---|---|---|---|---|---|---|---|---|---|---|---|---|---|---|---|---|---|---|---|---|---|---|---|---|---|---|---|---|---|---|---|---|---|---|---|---|---|---|---|---|---|---|---|---|---|---|---|---|---|---|---|---|---|---|---|---|---|---|---|---|---|---|---|---|---|---|---|---|---|---|---|---|---|---|---|---|---|---|---|---|---|---|---|---|---|---|---|---|---|---|---|---|---|---|---|---|---|---|---|---|---|---|---|---|---|---|---|---|---|---|---|---|---|---|---|---|---|---|---|---|---|---|---|---|---|---|---|---|---|---|---|---|---|---|---|---|---|---|---|---|---|---|---|---|---|---|---|---|---|---|---|---|---|---|---|---|---|---|---|---|---|---|---|---|---|---|---|---|---|---|---|---|---|---|---|---|---|---|
| NC Health and Human Services | 803 Biggs Dr | Raleigh | NC | 27603 | (919) 855-4713 | http://www.ncdhhs.gov/dsohf | 3700001 | NC-997 | State-operated agency | 5 | State operated agency | Other | Not a charter district | Open | 05/07/2025 | North Carolina | 37 | South | South Atlantic | 2024-2025 | 01 | 3006 Mail Service Center | Raleigh | NC | 27699 | 3006 | Wake County | 37183 | 11 | City, Large | PK,KG,1,2,3,4,5,6,7,8,9,10,11,12,13,UG | Open | 39580 | Raleigh-Cary, NC | 1 | 450 | Raleigh-Durham-Cary, NC | 3702 | 37038 | 37015 | No | 0 | PK-13 | PK | 13 | 2024-2025 | 2023 | 40 | 40 | 2024-2025 | source | 37183 | complete | US | 35.766421 | -78.656113 | https://nces.ed.gov/ccd/files.asp | |||||||||||||||||||||||||||||||||||||||||||||||||||||||||||||||||||||||||||||||||||||||||||||||||||||||||||||||||||||||||||||||||||||||||||||||||||||||
| Piedmont Community Charter | 2596 Robinwood Road | Gastonia | NC | 28054 | (704) 853-2428 | http://www.pccharter.org | 3700104 | NC-36B | Charter school agency | 7 | Independent charter district | Other | LEA for IDEA | Open | 05/07/2025 | North Carolina | 37 | South | South Atlantic | 2024-2025 | 01 | PO Box 3706 | Gastonia | NC | 28054 | Gaston County | 37071 | 13 | City, Small | 03 | Elementary-secondary school system | KG,1,2,3,4,5,6,7,8,9,10,11,12 | Open | 16740 | Charlotte-Concord-Gastonia, NC-SC | 1 | 172 | Charlotte-Concord, NC-SC | 3714 | 37109 | 37043 | No | 1 | K-12 | KG | 12 | 1963 | 2024-2025 | 134 | 1199 | 630 | 137 | 137 | 136 | 137 | 164 | 162 | 164 | 162 | 163 | 160 | 153 | 154 | 937 | 1026 | 1 | 0.1 | 29 | 1.5 | 383 | 19.5 | 460 | 23.4 | 0 | 0.0 | 133 | 6.8 | 957 | 48.8 | 128.89 | 8.50 | 86.64 | 33.75 | 4.00 | 3.00 | 1.00 | 0.00 | 0.00 | 128.89 | 15.2 | 20264000 | 2374000 | 13077000 | 4813000 | 219000 | 488000 | 0 | 25000 | 13000 | 0 | 0 | 0 | 0 | 630000 | 0 | 0 | 0 | 999000 | 12948000 | 0 | 0 | 0 | 0 | 0 | 0 | 129000 | 0 | 2578000 | 0 | 0 | 1347000 | 18339000 | 15083000 | 10037000 | 5046000 | 0 | 3256000 | 0 | 897000 | 554000 | 77000 | 1408000 | 1417000 | 9000 | 0 | 381000 | 323000 | 2552000 | 9866000 | 7152000 | 2522000 | 0 | 0 | 2023 | 1906 | 7913 | 5266 | 2647 | 10632 | 0 | No | 225 | 225 | 2024-2025 | 0 | 0 | 100 | 0 | 0 | 0 | 0 | 0 | 0 | 0 | 0 | 0 | source | 37071 | complete | US | 35.228232 | -81.153413 | https://nces.ed.gov/ccd/files.asp | |||||||||||||||||||||||||||||||||||
| Henderson Collegiate | 1071 Old Epsom Rd | Henderson | NC | 27536 | (252) 598-1038 | http://hendersoncollegiate.org | 3700319 | NC-91B | Charter school agency | 7 | Independent charter district | Other | LEA for IDEA | Open | 05/07/2025 | North Carolina | 37 | South | South Atlantic | 2024-2025 | 01 | 1071 Old Epsom Rd | Henderson | NC | 27536 | Vance County | 37181 | 32 | Town, Distant | 03 | Elementary-secondary school system | KG,1,2,3,4,5,6,7,8,9,10,11,12 | Open | 25780 | Henderson, NC | 2 | 450 | Raleigh-Durham-Cary, NC | 3701 | 37032 | 37011 | No | 1 | K-12 | KG | 12 | 1334 | 2024-2025 | 104 | 841 | 389 | 105 | 105 | 96 | 108 | 105 | 104 | 109 | 109 | 109 | 103 | 94 | 83 | 659 | 675 | 1 | 0.1 | 26 | 1.9 | 810 | 60.7 | 377 | 28.3 | 1 | 0.1 | 63 | 4.7 | 56 | 4.2 | 95.96 | 3.50 | 58.53 | 33.93 | 4.33 | 1.33 | 3.00 | 0.00 | 0.00 | 95.96 | 13.9 | 20809000 | 3600000 | 11300000 | 5909000 | 637000 | 158000 | 0 | 87000 | 63000 | 0 | 38000 | 0 | 789000 | 1828000 | 0 | 0 | 0 | 0 | 11300000 | 0 | 0 | 0 | 0 | 0 | 0 | 0 | 0 | 2052000 | 0 | 0 | 7000 | 19979000 | 15135000 | 8551000 | 5682000 | 902000 | 4844000 | 0 | 768000 | 634000 | 531000 | 2116000 | 800000 | 374000 | 902000 | 648000 | 21000 | 4175000 | 7827000 | 4991000 | 3157000 | 0 | 0 | 2023 | 1320 | 11466 | 6478 | 4305 | 15764 | 0 | No | 86 | 86 | 2024-2025 | 0 | 0 | 0 | 0 | 0 | 0 | 0 | 100 | 0 | 0 | 0 | 0 | source | 37181 | complete | US | 36.309808 | -78.39641 | https://nces.ed.gov/ccd/files.asp | |||||||||||||||||||||||||||||||||||
| Iredell Charter Academy of Arts & Scienc | 251 Home Improvement Street | Troutman | NC | 28166 | (704) 508-0104 | 3700400 | NC-49G | Charter school agency | 7 | Independent charter district | Elementary | LEA for IDEA | Open | 05/07/2025 | North Carolina | 37 | South | South Atlantic | 2024-2025 | 01 | 251 Home Improvement Street | Troutman | NC | 28166 | Iredell County | 37097 | 41 | Rural, Fringe | 01 | Elementary school system only | KG,1,2,3,4,5,6,7,8 | Open | 16740 | Charlotte-Concord-Gastonia, NC-SC | 1 | 172 | Charlotte-Concord, NC-SC | 3710 | 37084 | 37037 | No | 1 | K-8 | KG | 08 | 795 | 2024-2025 | 99 | 696 | 112 | 98 | 97 | 92 | 74 | 82 | 71 | 70 | 376 | 419 | 2 | 0.3 | 21 | 2.6 | 133 | 16.7 | 142 | 17.9 | 1 | 0.1 | 86 | 10.8 | 410 | 51.6 | 19.80 | 2.25 | 17.55 | 0.00 | 0.44 | 0.22 | 0.00 | 0.22 | 0.00 | 19.80 | 40.2 | 6946000 | 828000 | 4381000 | 1737000 | 61000 | 198000 | 0 | 16000 | 11000 | 0 | 0 | 0 | 306000 | 236000 | 0 | 0 | 0 | 0 | 4381000 | 0 | 0 | 0 | 0 | 0 | 0 | 0 | 0 | 1325000 | 0 | 21000 | 25000 | 7013000 | 5903000 | 3359000 | 2275000 | 269000 | 1110000 | 0 | 273000 | 124000 | 210000 | 631000 | 642000 | 135000 | 269000 | 4000 | 0 | 570000 | 3155000 | 2595000 | 649000 | 0 | 0 | 2023 | 627 | 9415 | 5357 | 3628 | 11078 | 0 | No | 114 | 114 | 2024-2025 | 0 | 0 | 0 | 0 | 0 | 0 | 0 | 0 | 0 | 100 | 0 | 0 | source | 37097 | complete | US | 35.664662 | -80.847793 | https://nces.ed.gov/ccd/files.asp | |||||||||||||||||||||||||||||||||||||||||
| Aspire Trade High School | 7125 Hambright Rd | Huntersville | NC | 28078 | (980) 399-7554 | http://aspiretradehs.org | 3700481 | NC-62N | Charter school agency | 7 | Independent charter district | Secondary | LEA for IDEA | Open | 05/07/2025 | North Carolina | 37 | South | South Atlantic | 2024-2025 | 01 | 7125 Hambright Rd. | Huntersville | NC | 28078 | Mecklenburg County | 37119 | 21 | Suburb, Large | 9,10,11 | Open | 16740 | Charlotte-Concord-Gastonia, NC-SC | 1 | 172 | Charlotte-Concord, NC-SC | 3714 | 37101 | 37038 | No | 1 | 9-11 | 09 | 11 | 270 | 2024-2025 | 270 | 123 | 98 | 49 | 198 | 72 | 0 | 0.0 | 4 | 1.5 | 100 | 37.0 | 84 | 31.1 | 0 | 0.0 | 24 | 8.9 | 58 | 21.5 | 13.67 | 13.67 | 1.00 | 1.00 | 0.00 | 0.00 | 13.67 | 19.8 | 2023 | 64 | 64 | 2024-2025 | 0 | 0 | 0 | 100 | 0 | 0 | 0 | 0 | 0 | 0 | 0 | 0 | source | 37119 | complete | US | 35.377844 | -80.906664 | https://nces.ed.gov/ccd/files.asp |
{}What's in each row
| Field | What it is | Rows filled |
|---|---|---|
| name | The district's official name as published in the federal district directory for the 2024-2025 school year. | 100% |
| lea | The seven-character NCES local education agency ID, the federal key for this district, kept as text so the leading zero on states 01 through 09 survives. | 100% |
| state | The identifier the district's own state uses for it, as reported to the federal directory. | 100% |
| school | The kind of agency this is in plain words, read off the federal agency-type code, such as a regular local school district, a supervisory union, a regional education service agency or a charter school agency. | 100% |
| agency | The federal agency-type code itself, a single digit from 1 to 9, which the schoolType column spells out. | 100% |
| agency | The federal directory's own wording for the agency type, carried through unchanged. | 100% |
| agency | The level the federal directory assigns the agency, one of Elementary, Middle, High, Other, Not applicable or Not reported. | 100% |
| agency | Whether the agency is a charter district and in what capacity, in the directory's own words, such as not a charter district, charter agency for federal programs, or charter agency for special education. | 100% |
| operational | Whether the agency was open, closed, new, inactive, future or a changed boundary at the time of the federal collection. | 100% |
| operational | The date that operational status took effect, as a month/day/year date from the federal directory. | 100% |
| address | The street address of the district's administrative office, not a school campus. | 100% |
| address2 | The second address line of the district office, such as a suite or floor, present on only 2.0% of rows because most offices do not have one. | 2% |
| city | The city of the district office, corrected during cleanup to the Census spelling for its postcode and standardised for capitalisation. | 100% |
| state | The two-letter state or territory code of the district office. | 100% |
| zip | The five-digit postcode of the district office, kept as text so a leading zero is not lost. | 100% |
| zip4 | The four-digit postcode extension of the district office, filled on 58.2% of rows because the federal directory does not carry it for every district. | 19% |
| country | The country, which is United States on every row in this file. | 100% |
| state | The full name of the state or territory, written in title case. | 100% |
| state | The two-digit federal state code, the standard numeric code for the state. | 100% |
| census | The Census region the district's state sits in — Northeast, Midwest, South or West — assigned from the state code using the standard federal grouping. | 100% |
| census | The Census division the district's state sits in, such as New England or Pacific, assigned from the state code using the standard federal grouping. | 100% |
| school | The school year this directory record describes, which is 2024-2025 throughout. | 100% |
| state | The state agency number from the federal directory, which identifies the state education agency the district reports through. | 100% |
| mailing | The district's mailing address where it differs from the street address, which for many rural offices is a post office box. | 100% |
| mailing | The city of the district's mailing address. | 100% |
| mailing | The two-letter state code of the district's mailing address. | 100% |
| mailing | The five-digit postcode of the district's mailing address, kept as text. | 100% |
| mailing | The four-digit postcode extension of the mailing address, filled on 61.2% of rows. | 30% |
| phone | The district office's main telephone number as published in the federal directory. | 100% |
| website | The district's own website address, published on 87.7% of rows; a blank means the federal directory carries no website for that district. | 69% |
| latitude | The latitude of the district's administrative office in decimal degrees, from the federal district-office geocode file. | 100% |
| longitude | The longitude of the district's administrative office in decimal degrees, from the federal district-office geocode file. | 100% |
| county | The county the district office sits in, taken from the federal geocode file and set or corrected during cleanup from the office coordinates, with a county recorded by the source kept when it is a real county in that state. | 100% |
| county | The five-digit federal county code for the district office, from the federal district-office geocode file. | 100% |
| locale | The two-digit federal urban-centric locale code for the district office, from 11 for a large city through 43 for remote rural. | 100% |
| locale | The locale code written out, such as City Large, Suburb Midsize, Town Remote or Rural Distant. | 100% |
| school | The two-digit school-level code the district reports on the federal finance survey, filled on 97.8% of rows. | 88% |
| school | The school-level code written out — elementary only, secondary only, elementary-secondary, vocational or special education, non-operating, or education service agency — filled on 95.2% of rows. | 88% |
| grades | A comma-separated list of every grade the district reports offering, from pre-kindergarten through grade 13 plus ungraded and adult education, filled on 94.6% of rows. | 91% |
| updated | The directory's updated status for the agency at the close of the collection, using the same open, closed, new, inactive, future and changed-boundary wording as the operational status. | 100% |
| cbsa | The five-digit federal code for the metropolitan or micropolitan statistical area the district office falls in, or the letter N where it falls in none. | 87% |
| cbsa | The name of that metropolitan or micropolitan statistical area, blank where the office falls in none. | 87% |
| cbsa | The federal geocode file's type code for the statistical area, which is 0 on exactly the 3,927 rows whose statistical-area code is N and 1 or 2 elsewhere. | 87% |
| csa | The three-digit federal code for the combined statistical area the district office falls in, or the letter N where it falls in none. | 79% |
| csa | The name of that combined statistical area, blank where the office falls in none. | 79% |
| congressional | The congressional district the office sits in, written as the two-digit state code followed by the two-digit district number. | 100% |
| state | The state legislative district, lower chamber, containing the office, written as the two-digit state code followed by the district number, or the letter N where the state has no such district. | 100% |
| state | The state legislative district, upper chamber, containing the office, written as the two-digit state code followed by the district number, or the letter N where the state has no such district. | 100% |
| out | Yes where the federal directory flags the district office as physically located outside the state that reports it, which is true of 196 rows. | 100% |
| number | The number of schools the district was operating in the 2024-2025 school year, as a count. | 100% |
| grade | The district's grade span written the way people say it, such as PK-12 or K-8, filled on 96.3% of rows. | 96% |
| lowest | The federal code for the lowest grade the district offers, such as PK, KG or a two-digit grade number. | 91% |
| highest | The federal code for the highest grade the district offers, such as 08 or 12. | 91% |
| enrollment | Total students enrolled across the district in the 2024-2025 school year, as a count of students, filled on 94.2% of rows. | 89% |
| reference | The school year the directory, enrolment and staffing figures describe, which is 2024-2025 on every row. | 100% |
| source | The federal page this record was taken from, so every row carries its own citation. | 100% |
| enrollment | Students enrolled in pre-kindergarten, as a count, filled on 57.5% of rows because most districts do not run a pre-kindergarten programme. | 31% |
| enrollment | Students enrolled in kindergarten, as a count, filled on 82.6% of rows. | 82% |
| enrollment | Students enrolled in grades 1 through 8 added together, as a count, left blank where any grade in that range was suppressed. | 87% |
| enrollment | Students enrolled in grades 9 through 13 added together, as a count, left blank where any grade in that range was suppressed. | 59% |
| enrollment | Students enrolled in grade 1, as a count. | 82% |
| enrollment | Students enrolled in grade 2, as a count. | 82% |
| enrollment | Students enrolled in grade 3, as a count. | 82% |
| enrollment | Students enrolled in grade 4, as a count. | 81% |
| enrollment | Students enrolled in grade 5, as a count. | 82% |
| enrollment | Students enrolled in grade 6, as a count. | 83% |
| enrollment | Students enrolled in grade 7, as a count. | 82% |
| enrollment | Students enrolled in grade 8, as a count. | 80% |
| enrollment | Students enrolled in grade 9, as a count. | 59% |
| enrollment | Students enrolled in grade 10, as a count. | 58% |
| enrollment | Students enrolled in grade 11, as a count. | 58% |
| enrollment | Students enrolled in grade 12, as a count. | 56% |
| enrollment | Students enrolled in grade 13, as a count, filled on 0.8% of rows because very few states have a thirteenth grade. | 20% |
| enrollment | Students reported as male, as a count, left blank rather than set to zero where any part of the total was suppressed. | 89% |
| enrollment | Students reported as female, as a count, left blank rather than set to zero where any part of the total was suppressed. | 89% |
| students | Students reported as American Indian or Alaska Native, as a count, left blank where any part of the total was suppressed. | 89% |
| pct | American Indian or Alaska Native students as a percentage of the district's total enrolment, to one decimal place. | 89% |
| students | Students reported as Asian, as a count, left blank where any part of the total was suppressed. | 89% |
| pct | Asian students as a percentage of the district's total enrolment, to one decimal place. | 89% |
| students | Students reported as Black or African American, as a count, left blank where any part of the total was suppressed. | 89% |
| pct | Black or African American students as a percentage of the district's total enrolment, to one decimal place. | 89% |
| students | Students reported as Hispanic or Latino, as a count, left blank where any part of the total was suppressed. | 89% |
| pct | Hispanic or Latino students as a percentage of the district's total enrolment, to one decimal place. | 89% |
| students | Students reported as Native Hawaiian or Other Pacific Islander, as a count, left blank where any part of the total was suppressed. | 89% |
| pct | Native Hawaiian or Other Pacific Islander students as a percentage of the district's total enrolment, to one decimal place. | 89% |
| students | Students reported as two or more races, as a count, left blank where any part of the total was suppressed. | 89% |
| pct | Students of two or more races as a percentage of the district's total enrolment, to one decimal place. | 89% |
| students | Students reported as White, as a count, left blank where any part of the total was suppressed. | 89% |
| pct | White students as a percentage of the district's total enrolment, to one decimal place. | 89% |
| teachers | All teachers in the district counted as full-time equivalents, so a half-time teacher counts as half a person. | 87% |
| teachers | Pre-kindergarten teachers as full-time equivalents, filled on 75.5% of rows. | 31% |
| teachers | Kindergarten teachers as full-time equivalents, filled on 88.4% of rows. | 79% |
| teachers | Elementary teachers as full-time equivalents, filled on 91.9% of rows. | 84% |
| teachers | Secondary teachers as full-time equivalents, filled on 90.2% of rows. | 80% |
| teachers | Teachers of ungraded classes as full-time equivalents, filled on 47.1% of rows. | 25% |
| guidance | All guidance counsellors as full-time equivalents, filled on 91.7% of rows. | 87% |
| guidance | Elementary school counsellors as full-time equivalents, filled on 76.5% of rows. | 83% |
| guidance | Secondary school counsellors as full-time equivalents, filled on 76.1% of rows. | 80% |
| school | Staff the district reports under the separate school counsellor category as full-time equivalents, filled on 65.2% of rows. | 85% |
| school | School psychologists as full-time equivalents, filled on 89.9% of rows. | 87% |
| teachers | The same total teacher count as teachersTotalFte, repeated under the shorter name buyers of comparable files expect. | 87% |
| student | Students per teacher, calculated as total enrolment divided by total teacher full-time equivalents and rounded to one decimal place, filled on 90.9% of rows. | 87% |
| rev | Total revenue from all sources, in dollars, for fiscal year 2023; the whole finance block is present on 91.8% of rows. | 86% |
| rev | Total federal revenue, in dollars, for fiscal year 2023. | 86% |
| rev | Total state revenue, in dollars, for fiscal year 2023. | 86% |
| rev | Total local revenue, in dollars, for fiscal year 2023. | 86% |
| rev | Federal revenue received through the state for Title I, in dollars, for fiscal year 2023. | 86% |
| rev | Federal revenue received through the state under the Individuals with Disabilities Education Act, in dollars, for fiscal year 2023. | 86% |
| rev | Federal revenue received through the state for career and technical education, in dollars, for fiscal year 2023. | 86% |
| rev | Federal revenue received through the state for supporting effective instruction, in dollars, for fiscal year 2023. | 86% |
| rev | Federal revenue received through the state for student support and academic enrichment, in dollars, for fiscal year 2023. | 86% |
| rev | Federal revenue received through the state for 21st Century Community Learning Centers, in dollars, for fiscal year 2023. | 86% |
| rev | Federal revenue received through the state for the rural and low-income school programme, in dollars, for fiscal year 2023. | 86% |
| rev | Federal revenue received through the state for bilingual education, in dollars, for fiscal year 2023. | 86% |
| rev | Federal revenue received through the state under the Child Nutrition Act, in dollars, for fiscal year 2023. | 86% |
| rev | All other federal revenue received through the state, in dollars, for fiscal year 2023. | 86% |
| rev | Federal revenue received directly as Impact Aid, the payment to districts with tax-exempt federal land or military families, in dollars, for fiscal year 2023. | 86% |
| rev | Federal revenue received directly for Indian education, in dollars, for fiscal year 2023. | 86% |
| rev | Federal revenue received directly under the small rural school achievement programme, in dollars, for fiscal year 2023. | 86% |
| rev | All other federal revenue received directly rather than through the state, in dollars, for fiscal year 2023. | 86% |
| rev | State revenue from general formula assistance, the main state funding formula, in dollars, for fiscal year 2023. | 86% |
| rev | State revenue for special education programmes, in dollars, for fiscal year 2023. | 86% |
| rev | State revenue for compensatory and basic skills programmes, in dollars, for fiscal year 2023. | 86% |
| rev | State revenue for career and technical education programmes, in dollars, for fiscal year 2023. | 86% |
| rev | State revenue for school meal programmes, in dollars, for fiscal year 2023. | 86% |
| rev | State revenue for capital outlay and debt service programmes, in dollars, for fiscal year 2023. | 86% |
| rev | State revenue for transportation programmes, in dollars, for fiscal year 2023. | 86% |
| rev | State revenue for all other state programmes, in dollars, for fiscal year 2023. | 86% |
| rev | Local revenue from property taxes, in dollars, for fiscal year 2023, filled on 62.9% of rows because districts that do not levy their own tax report nothing on this line. | 12% |
| rev | Local revenue transferred from the parent city or county government that the district is a dependent part of, in dollars, for fiscal year 2023, filled on 6.0% of rows. | 31% |
| rev | Local revenue from general sales taxes, in dollars, for fiscal year 2023, filled on 62.6% of rows. | 12% |
| rev | Local revenue received from other school systems, in dollars, for fiscal year 2023. | 86% |
| rev | Local revenue received from cities and counties, in dollars, for fiscal year 2023. | 86% |
| rev | Local revenue from tuition fees paid by pupils and parents, in dollars, for fiscal year 2023. | 86% |
| rev | Local revenue from school meal sales, in dollars, for fiscal year 2023. | 86% |
| rev | Local revenue from interest earnings, in dollars, for fiscal year 2023. | 86% |
| exp | Total expenditure of every kind, in dollars, for fiscal year 2023. | 86% |
| exp | Total current spending on elementary and secondary education, in dollars, for fiscal year 2023, which is instruction plus support services plus other current spending. | 86% |
| exp | Total current spending on instruction, in dollars, for fiscal year 2023. | 86% |
| exp | Total current spending on support services, in dollars, for fiscal year 2023. | 86% |
| exp | Total other current elementary and secondary spending, in dollars, for fiscal year 2023, which is mostly food services and enterprise operations. | 86% |
| exp | Total capital outlay, in dollars, for fiscal year 2023. | 86% |
| exp | Total spending on activities outside elementary and secondary education, such as community services and adult education, in dollars, for fiscal year 2023. | 86% |
| exp | Current spending on support services for students, in dollars, for fiscal year 2023. | 86% |
| exp | Current spending on support services for instructional staff, in dollars, for fiscal year 2023. | 86% |
| exp | Current spending on general administration, in dollars, for fiscal year 2023. | 86% |
| exp | Current spending on school administration, in dollars, for fiscal year 2023. | 86% |
| exp | Current spending on operation and maintenance of plant — buildings, grounds and utilities — in dollars, for fiscal year 2023. | 86% |
| exp | Current spending on student transportation, in dollars, for fiscal year 2023. | 86% |
| exp | Current spending on food services, in dollars, for fiscal year 2023. | 86% |
| exp | Capital outlay on construction, in dollars, for fiscal year 2023. | 86% |
| exp | Capital outlay on instructional equipment, in dollars, for fiscal year 2023. | 86% |
| exp | Capital outlay on all other equipment, in dollars, for fiscal year 2023. | 86% |
| exp | Total salaries paid across the district, in dollars, for fiscal year 2023. | 86% |
| exp | Salaries paid for instruction, in dollars, for fiscal year 2023. | 86% |
| exp | Total employee benefits, in dollars, for fiscal year 2023. | 86% |
| exp | Interest paid on debt, in dollars, for fiscal year 2023. | 86% |
| exp | Payments made to charter schools, in dollars, for fiscal year 2023. | 86% |
| finance | The fiscal year the whole finance block describes, which is 2023, the most recent year published, and is carried on every row that has finance data so the year is never in doubt. | 97% |
| finance | Fall membership as reported on the finance survey, the student count the survey itself uses as its denominator, filled on 89.9% of rows. | 88% |
| per | Current elementary and secondary spending for fiscal year 2023 in dollars per pupil, the district's total current spending divided by its fall membership, blank where either part was not reported. | 86% |
| per | Instruction spending for fiscal year 2023 in dollars per pupil, the district's instruction spending divided by its fall membership, blank where either part was not reported. | 86% |
| per | Support services spending for fiscal year 2023 in dollars per pupil, the district's support services spending divided by its fall membership, blank where either part was not reported. | 86% |
| per | Total revenue for fiscal year 2023 in dollars per pupil, the district's total revenue from all sources divided by its fall membership, blank where either part was not reported. | 86% |
| impact | The same Impact Aid figure as revFedImpactAid, in dollars, for fiscal year 2023, repeated under the name buyers of comparable files expect. | 86% |
| receives | Yes where the district reported Impact Aid above zero for fiscal year 2023, No where it reported exactly zero, and blank where it filed no finance return at all. | 86% |
| erate | The E-Rate funding year the single-year commitment columns describe, which is 2025 wherever the district could be matched to its E-Rate applicant record. | 28% |
| erate | Federal E-Rate money committed to this district for the latest funding year, in dollars, present on 28.9% of rows; a blank means the district could not be matched to an E-Rate applicant with certainty, not that it received nothing. | 28% |
| erate | The number of E-Rate funding requests committed to this district in the latest funding year, as a count, present on 28.9% of rows. | 28% |
| erate | Federal E-Rate money committed to this district across the three most recent funding years combined, in dollars, present on 31.7% of rows. | 28% |
| erate | The number of E-Rate funding requests committed to this district across the three most recent funding years combined, as a count, present on 31.7% of rows. | 28% |
| idea | Students served under Part B of the Individuals with Disabilities Education Act, early childhood and school age combined, as a count for 2024-2025, present on 87.8% of rows; where a count was suppressed to protect the privacy of a small group the cell is left empty rather than set to zero. | 90% |
| idea | Students aged three to five served under Part B of the Individuals with Disabilities Education Act, as a count for 2024-2025, present on 64.9% of rows and left empty where the count was suppressed for privacy. | 32% |
| idea | School-age students served under Part B of the Individuals with Disabilities Education Act, as a count for 2024-2025, present on 80.0% of rows and left empty where the count was suppressed for privacy. | 90% |
| idea | The year the special-education counts describe, which is 2024-2025 wherever the district appears in that collection. | 90% |
| locale | The percentage of the district that sits in a large city, from the federal geocode file; the twelve locale share columns add to 100 for a district, and a value of minus 2 is the source file's not-available marker rather than a percentage. | 94% |
| locale | The percentage of the district that sits in a midsize city, where minus 2 is the source file's not-available marker rather than a percentage. | 94% |
| locale | The percentage of the district that sits in a small city, where minus 2 is the source file's not-available marker rather than a percentage. | 94% |
| locale | The percentage of the district that sits in a large suburb, where minus 2 is the source file's not-available marker rather than a percentage. | 94% |
| locale | The percentage of the district that sits in a midsize suburb, where minus 2 is the source file's not-available marker rather than a percentage. | 94% |
| locale | The percentage of the district that sits in a small suburb, where minus 2 is the source file's not-available marker rather than a percentage. | 94% |
| locale | The percentage of the district that sits in a fringe town, where minus 2 is the source file's not-available marker rather than a percentage. | 94% |
| locale | The percentage of the district that sits in a distant town, where minus 2 is the source file's not-available marker rather than a percentage. | 94% |
| locale | The percentage of the district that sits in a remote town, where minus 2 is the source file's not-available marker rather than a percentage. | 94% |
| locale | The percentage of the district that sits in fringe rural territory, where minus 2 is the source file's not-available marker rather than a percentage. | 94% |
| locale | The percentage of the district that sits in distant rural territory, where minus 2 is the source file's not-available marker rather than a percentage. | 94% |
| locale | The percentage of the district that sits in remote rural territory, where minus 2 is the source file's not-available marker rather than a percentage. | 94% |
| geo_ | How the coordinates on this row were arrived at during cleanup — source where the federal geocode was kept as published (19,631 rows), address where the point was missing or fell outside its own state and was re-placed by geocoding the street address (3 rows), and zip centroid where only the postcode centre could be used (2 rows). | 100% |
| county_ | The five-digit federal county code set during cleanup from the office coordinates against Census county boundaries, with independent cities treated as their own county; it agrees with the geocode file's own county code on all but 14 rows. | 100% |
| address_ | How usable the street address is, checked during cleanup — complete on 19,343 rows, no house number on 291 rows where the address has a street but no number, and po box on 2 rows where the office address is a post office box. | 100% |
Rows filled is measured on every row of the delivered file.
✓Where this data comes from
This dataset is built from the federal Common Core of Data — the NCES directory of every local education agency — joined on the LEA's own federal ID to the NCES EDGE district-office geocode, the Census/NCES F-33 school district finance survey, the Department of Education's IDEA Section 618 special-education child counts and USAC's published E-Rate commitments. Nothing is taken from a district's own website and nothing is taken from a licensed third-party product: every column traces to a file the federal government publishes. E-Rate is the one fuzzy join — USAC's own district IDs are frequently wrong, so applicants are matched on name, state and postcode instead, and the column is left empty where that match is not confident.
September 15, 2026
File built
209 fields
Columns in the file
Fill measured
On every row of the delivered file
Districts are published as the federal collection holds them. Counts suppressed at source for student privacy are left empty rather than set to zero, city spellings are corrected to the Census place name for their postcode, map points that fell outside their own state are re-placed, and every row carries the county, a coordinate-precision flag and an address-quality flag. There are no personal names, job titles or email addresses: the federal government no longer publishes the superintendent, and none is guessed.
How we build and date every file: methodology.
Using ChatGPT, Claude or an API?
No setup needed. Ask ChatGPT or Claude your question about the School Districts in North Carolina and give it this page: it can open https://locationlists.com/find?dataset=school-district-list-nc with the filters you need and show you the count and price.
Using ChatGPT or Claude? Tell it to answer from locationlists.com/find — no account, no connector.
How assistants ask
No connector needed. Any AI assistant can answer from this site with a web link, no connector, no account: open https://locationlists.com/find with the question as query parameters.
If a question needs filtering, distance, combining lists or a price, open a /find link: either put the question itself in q=, or build the structured link. The answer does not need an API, a connector or an account.
Simplest, the question itself: https://locationlists.com/find?q=<the question in plain words>
Or set the parts yourself: https://locationlists.com/find?dataset=<slug>&state=<ST>&city=<city>&county=<county>&zip=<zip>&near=<place or zip>&radius=<miles>&where=<column>:<op>:<value>&total=<rows>
Leave out what the question does not need. Distance is radius, in straight-line miles; near can name several places separated by | to reach from any of them. To ask about several lists at once, use datasets with two or more names, or category with a kind of business. To compare two lists, add relate=nearest and the other list with b. in front of its parameters. To count by area, use areas=county (or zip, state, metro). To keep only places whose county, ZIP code, metro area or state meets a Census figure, add area_where (for example county:population>1000000); with areas, per=100000 gives counts per 100,000 residents.
Links an assistant can open, each showing how many rows match, a few preview rows and the price for just that part:
- Within 25 miles of Charlotte, NC, the busiest area: https://locationlists.com/find?dataset=school-district-list-nc&near=Charlotte+NC&radius=25
- Only rows where mailingZip is over 28054: https://locationlists.com/find?dataset=school-district-list-nc&where=mailingZip%3Agt%3A28054
- The whole list: add a city, state, ZIP code or distance:
https://locationlists.com/find?dataset=school-district-list-nc - In plain words: "School Districts in North Carolina within 25 miles of Charlotte, NC": https://locationlists.com/find?q=School+Districts+in+North+Carolina+within+25+miles+of+Charlotte%2C+NC
Optional: connect for repeat use or wallet payments:
Read https://locationlists.com/skill.md and follow the instructions to connect LocationLists. Then show me the School Districts in North Carolina list.Your assistant will walk you through setup and show you the price before you pay.
For developers
At 376 records this dataset is not sold by the row — buy the file. Without a connector, open https://locationlists.com/find?dataset=school-district-list-nc. An agent connected to https://locationlists.com/mcp can still search it, read a free sample file of up to 10 rows and buy the whole file itself. How agent purchasing works
?Frequently Asked Questions
How many School Districts are there in North Carolina?
There are 376 School Districts in North Carolina as of September 2026.
What is one row?
One local education agency, located at its administrative office. The coordinates are the office, not a school campus and not the middle of a district boundary — so a drive-time or radius filter gives you the place a purchasing decision is actually made.
Why 376 districts when I always hear about 13,000?
Both numbers are right and they count different things. The federal universe is 376 local education agencies, which includes supervisory unions, regional service agencies, state-run agencies and 4,213 independent charter agencies that each operate their own school. Regular public school districts that actually run schools number 13,377. Every row carries a district type column so you can cut it either way, and we also sell each cut as its own file.
What money information is in it?
Per district: total revenue split into federal, state and local; 20 separate revenue lines including Title I and the IDEA special-education grant; 22 expenditure lines including instruction, support services, transportation, buildings, equipment, salaries and benefits; per-pupil current spending, instruction and revenue; and Impact Aid, the federal payment to districts with tax-exempt federal land or military families. 91.8% of rows carry the finance block and 1,660 districts receive Impact Aid. The finance year is FY2023, which is the most recent one published, and it is on every row. One caution on the per-pupil columns: 99.17% of them land in the normal $3,000-$60,000 range, and the 142 that do not are mostly county offices of education, which spend on students across a whole county while directly enrolling a handful. Their per-pupil figure is arithmetically right and practically meaningless — sort those by total spending instead. You are never guessing which year you are looking at.
What is the special-education count?
The number of students served under Part B of the Individuals with Disabilities Education Act, from the Department of Education's own collection for 2024-25, split into early childhood and school age. 87.8% of rows have it. Where a count was suppressed for privacy because the group was too small, the cell is left empty rather than set to zero.
What does the E-Rate column tell me, and why is it only on some rows?
E-Rate is the federal programme that pays most of a district's internet and network bill. Where we can match a district to its funding requests we give you the committed dollars and the number of requests, for the latest funding year and for three years together. It is on 28.9% of rows. The reason it is not on all of them is that the E-Rate records identify applicants by a billing number, and the official district ID field in those records is filled in on fewer than one in ten and is frequently wrong where it is filled in — we checked, and most of the ID values that disagree with ours are not valid district IDs at all. So we match on district name, state and postcode and only keep a match that can only be one district. A blank means we could not prove the match, not that the district received nothing.
How complete are the contact details?
Street address, city, state, postcode and map coordinates on every row. Phone on 99.9%. A district website on 87.7%. A separate mailing address ships as its own columns, because a good number of rural district offices take post at a box and deliveries at a street.
What was cleaned up before you sold it?
Before selling it, we unified 233 city names that were written more than one way inside the same postcode, corrected 18 misspelled city names, standardised the capitalisation on 6,545 more, found and re-placed 5 map points that fell outside their own state, set the county and federal county code on 19,626 rows, and kept 8 records that share a name and a building but are genuinely different agencies, which a plain duplicate check would have deleted. Every row also carries an address quality flag (complete, missing house number, or PO box) and a coordinate quality flag, so you can see which rows to trust for a routing job rather than finding out later.
Is every state covered?
Yes, all 50 states plus DC and the territories are in the national file. Not every state gets its own separate file, though: **Hawaii has exactly one school district** — the state runs a single statewide system — and Puerto Rico, Guam, American Samoa, the Northern Mariana Islands and the US Virgin Islands have between one and five agencies each. A one-row file is not a product, so those rows live in the national file and the operating, charter and large-district cuts, and there is no standalone state list for them. Every other state has one.
Why are some cells empty?
Because the federal source says so, and we would rather show you an empty cell than a code you have to decode. Where a district sits in no metro area, the metro columns are blank rather than the letter N the source writes. Where a count was too small to publish without identifying students, it is blank rather than zero — an empty cell means not reported, never none. Where the urban/rural share was not calculated for a district, the twelve share columns are blank rather than -2. In this build we replaced 42,078 such placeholder codes across 27 columns with empty cells, so a completeness figure means what it says.
Can I match this to a list of individual schools?
Yes. Every row carries its federal district ID, which is the same ID used on every public school record, so a district file and a school file join directly with no name matching.
How often is it updated?
File built on September 15, 2026. It is not on an automatic refresh schedule, so check the build date above before you buy.
Where exactly does it come from?
All of it is United States federal government data, in the public domain: the federal Common Core of Data, the NCES EDGE district-office geocode, the Census/NCES F-33 school district finance survey, the Department of Education's IDEA Section 618 special-education counts, and USAC's published E-Rate commitments. Nothing in the file was bought, licensed or taken from another company's product.
Does this include the superintendent's name or email?
No. There are no personal names, job titles or email addresses anywhere in this file. The federal government stopped publishing the superintendent's name years ago — it is not in the district directory, not in the underlying data file, and not in EDFacts — so there is no official source to take it from, and we do not guess names or invent address patterns. If you need a named contact you will need a contact database on top of this. That absence is why this file costs a fraction of one.
Does it include school calendars, term dates or board meeting dates?
No. Term start and end dates, holidays and board meeting schedules are set district by district and are not collected in any national federal dataset. Nothing in this file is a calendar date except the reporting years, which are labelled.
Does it include COVID relief or ESSER funding?
No. ESSER money was awarded in 2020-2022 and the obligation period closed in September 2024. The Department of Education's district-level allocation tables are no longer published, and the one remaining source identifies recipients by a business registration number rather than a district ID, so there is no reliable way to attach it to the right district. We left it out rather than attach it to the wrong one.
Does it include test scores, ratings or school boundaries?
No. There is no rating, no proficiency score and no boundary polygon. District boundaries are published federally as map shapes and belong in a map file, not a spreadsheet column — ask if you want them and we will cut them as a separate file.