SBA 7(a) Lenders
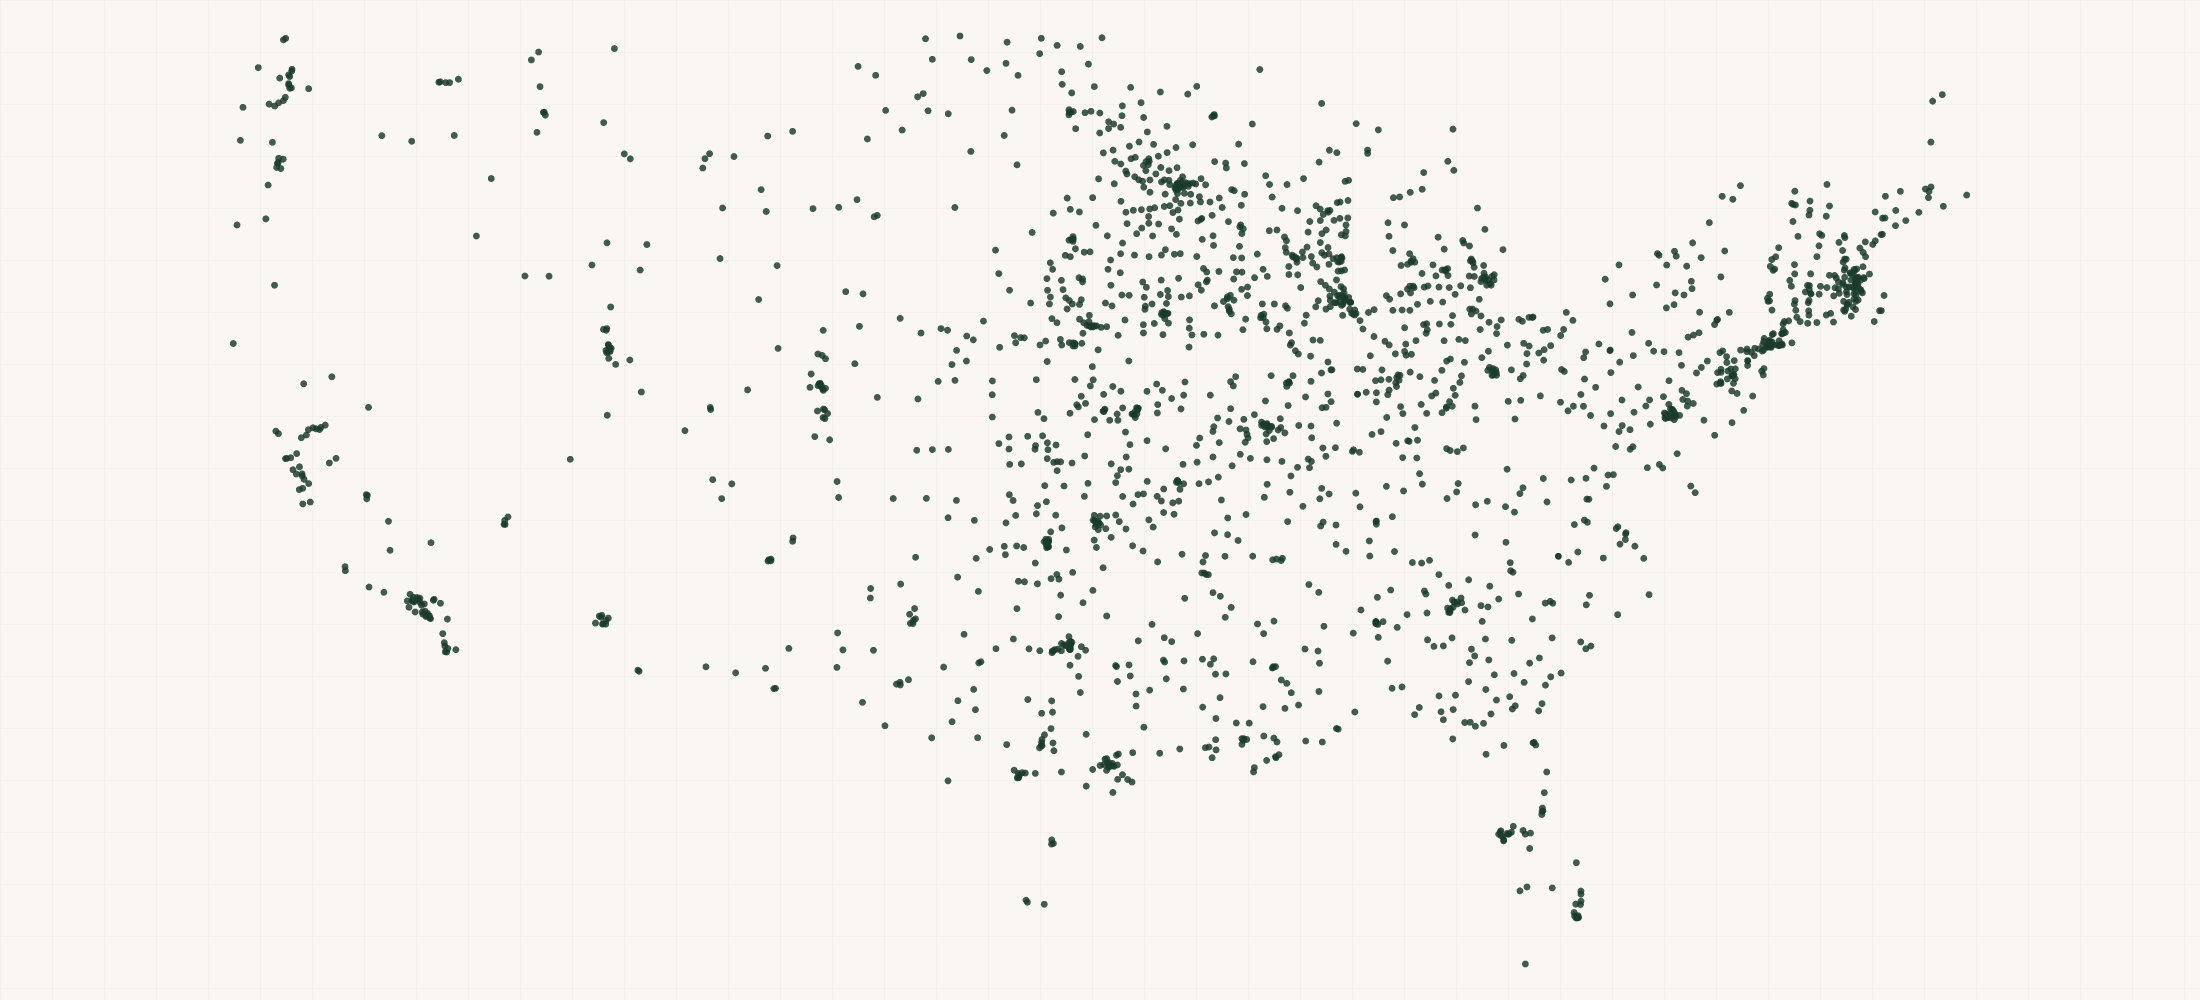
All 50 states, DC and US territories; lenders active FY2020 to FY2026 · 2,341 locations
There are 2,341 SBA 7(a) Lenders in the US as of November 2026. The CSV has address, city, state, ZIP and GPS. Full file $99; free 10-row sample. They are in all 50 states, DC and Puerto Rico.
2,341 lenders that approved at least one SBA 7(a) loan between October 2019 and September 2026, built on 7 November 2026 from SBA's own loan-level FOIA file. 1,872 are FDIC-insured banks, 320 are credit unions and 149 are non-bank lenders such as small business lending companies.
More about this list
1,237 of them made a loan in fiscal year 2026. Together they approved about 48,500 loans for about $29 billion that year. The 25 busiest lenders made about 59% of those loans. Each row is one lender with its head office address and map point. It carries total loans and dollars since FY2020 and loans and dollars for each fiscal year from 2020 to 2026. It counts loans in eight size bands for each year, from under $150,000 up to the $5 million maximum. It counts business acquisition loans for each year and those at $2.5 million and up on their own. For FY2026 it adds the average loan, average interest rate, variable-rate share, average term, Preferred Lender and SBA Express shares, secondary-market sales, franchise and new-business shares, the top borrower industry and state, and the lender's rank by loans and by dollars. Charge-offs, paid-in-full and canceled loans and jobs supported cover the whole period. Every count and dollar figure leaves out canceled loans. They sit in a column of their own. About 1,570 lenders made at least one business acquisition loan. 116 made ten or more in FY2026. 44 made five or more at $2.5 million and up. Those are the deals where SBA's rules now call for a quality of earnings report. Use it to find the lenders that fund acquisitions, rank lenders in a state or by loan size, target banks for a lender service, or read a bank's SBA program against its peers.
Need just some of them? Ask in your own words.
●Where the rows are
≡Sample Data Preview
| name | address | city | state | zip | lender id | lender type | fdic cert | ncua charter | address as of | active fy2026 | total loans | total dollars | total change of ownership | total change of ownership dollars | loans lt 150k | loans 150k 350k | loans 350k 500k | loans 500k 1m | loans 1m 2m | loans 2m 3m | loans 3m 5m | loans 5m plus | fy2020 loans | fy2020 dollars | fy2020 change of ownership | fy2020 change of ownership 2 5m plus | fy2020 lt 150k | fy2020 150k 350k | fy2020 350k 500k | fy2020 500k 1m | fy2020 1m 2m | fy2020 2m 3m | fy2020 3m 5m | fy2020 5m plus | fy2021 loans | fy2021 dollars | fy2021 change of ownership | fy2021 change of ownership 2 5m plus | fy2021 lt 150k | fy2021 150k 350k | fy2021 350k 500k | fy2021 500k 1m | fy2021 1m 2m | fy2021 2m 3m | fy2021 3m 5m | fy2021 5m plus | fy2022 loans | fy2022 dollars | fy2022 change of ownership | fy2022 change of ownership 2 5m plus | fy2022 lt 150k | fy2022 150k 350k | fy2022 350k 500k | fy2022 500k 1m | fy2022 1m 2m | fy2022 2m 3m | fy2022 3m 5m | fy2022 5m plus | fy2023 loans | fy2023 dollars | fy2023 change of ownership | fy2023 change of ownership 2 5m plus | fy2023 lt 150k | fy2023 150k 350k | fy2023 350k 500k | fy2023 500k 1m | fy2023 1m 2m | fy2023 2m 3m | fy2023 3m 5m | fy2023 5m plus | fy2024 loans | fy2024 dollars | fy2024 change of ownership | fy2024 change of ownership 2 5m plus | fy2024 lt 150k | fy2024 150k 350k | fy2024 350k 500k | fy2024 500k 1m | fy2024 1m 2m | fy2024 2m 3m | fy2024 3m 5m | fy2024 5m plus | fy2025 loans | fy2025 dollars | fy2025 change of ownership | fy2025 change of ownership 2 5m plus | fy2025 lt 150k | fy2025 150k 350k | fy2025 350k 500k | fy2025 500k 1m | fy2025 1m 2m | fy2025 2m 3m | fy2025 3m 5m | fy2025 5m plus | fy2026 loans | fy2026 dollars | fy2026 change of ownership | fy2026 change of ownership 2 5m plus | fy2026 lt 150k | fy2026 150k 350k | fy2026 350k 500k | fy2026 500k 1m | fy2026 1m 2m | fy2026 2m 3m | fy2026 3m 5m | fy2026 5m plus | fy2026 avg loan | fy2026 avg interest rate | fy2026 variable rate share | fy2026 avg term months | fy2026 plp share | fy2026 express share | fy2026 sold secondary share | fy2026 franchise share | fy2026 new business share | fy2026 borrower states | charge offs | charge off dollars | charge off rate | paid in full | cancelled | jobs supported | first approval date | last approval date | fy2026 rank by loans | fy2026 rank by dollars | rank by total dollars | fy2026 top industry | fy2026 top industry share | fy2026 top borrower state | fy2026 top borrower state share | source date | fiscal years covered | geo precision | county | county fips | county note | address quality | country | latitude | longitude | source url |
|---|---|---|---|---|---|---|---|---|---|---|---|---|---|---|---|---|---|---|---|---|---|---|---|---|---|---|---|---|---|---|---|---|---|---|---|---|---|---|---|---|---|---|---|---|---|---|---|---|---|---|---|---|---|---|---|---|---|---|---|---|---|---|---|---|---|---|---|---|---|---|---|---|---|---|---|---|---|---|---|---|---|---|---|---|---|---|---|---|---|---|---|---|---|---|---|---|---|---|---|---|---|---|---|---|---|---|---|---|---|---|---|---|---|---|---|---|---|---|---|---|---|---|---|---|---|---|---|---|---|---|---|---|---|---|---|---|---|---|---|---|---|---|
| Alaska Growth Capital BIDCO, Inc. | 3900 C Street | Anchorage | AK | 99503 | NAME-ALASKAGROWTHCAPITALBIDCOINC | Non-bank lender | 2026-09-21 | Y | 95 | 109818500 | 16 | 21060000 | 8 | 16 | 16 | 17 | 19 | 10 | 8 | 1 | 11 | 9635000 | 0 | 0 | 3 | 2 | 2 | 0 | 2 | 2 | 0 | 0 | 15 | 13050000 | 1 | 0 | 0 | 4 | 2 | 4 | 3 | 2 | 0 | 0 | 21 | 21977400 | 4 | 0 | 1 | 3 | 2 | 7 | 6 | 1 | 1 | 0 | 15 | 15304100 | 1 | 0 | 1 | 3 | 3 | 4 | 1 | 1 | 2 | 0 | 11 | 11382000 | 3 | 0 | 3 | 2 | 1 | 0 | 3 | 1 | 1 | 0 | 13 | 16370000 | 5 | 1 | 0 | 2 | 4 | 2 | 2 | 2 | 1 | 0 | 9 | 22100000 | 2 | 1 | 0 | 0 | 2 | 0 | 2 | 1 | 3 | 1 | 2455556 | 9.6 | 1 | 202 | 0.667 | 0 | 0.556 | 0 | 0.222 | 2 | 0 | 0 | 0 | 31 | 19 | 1663 | 2019-10-23 | 2026-09-21 | 424 | 203 | 254 | Breweries | 0.111 | AK | 0.889 | 2026-09-30 | FY2020-FY2026 | address | Anchorage Municipality | 02020 | ZIP 99503 spans 2 counties; assigned to the county holding 16% of its land area | complete | US | 61.186378 | -149.886703 | https://data.sba.gov/sites/default/files/uploaded_resources/FOIA_7a_FY2020_Present_asof_260930.csv | ||
| Georgia Community Bank | 704 N. Westover Blvd. | Albany | GA | 31707 | FDIC-35320 | Bank | 35320 | 2024-04-02 | N | 2 | 795000 | 0 | 0 | 0 | 1 | 1 | 0 | 0 | 0 | 0 | 0 | 0 | 0 | 0 | 0 | 0 | 0 | 0 | 0 | 0 | 0 | 0 | 0 | 0 | 0 | 0 | 0 | 0 | 0 | 0 | 0 | 0 | 0 | 0 | 0 | 0 | 0 | 0 | 0 | 0 | 0 | 0 | 0 | 0 | 0 | 0 | 0 | 1 | 499000 | 0 | 0 | 0 | 0 | 1 | 0 | 0 | 0 | 0 | 0 | 1 | 296000 | 0 | 0 | 0 | 1 | 0 | 0 | 0 | 0 | 0 | 0 | 0 | 0 | 0 | 0 | 0 | 0 | 0 | 0 | 0 | 0 | 0 | 0 | 0 | 0 | 0 | 0 | 0 | 0 | 0 | 0 | 0 | 0 | 0 | 0 | 0 | 0 | 0 | 0 | 0 | 0 | 20 | 2023-06-28 | 2024-04-02 | 1845 | 2026-09-30 | FY2020-FY2026 | address | Dougherty County | 13095 | ZIP 31707 spans 2 counties; assigned to the county holding 91% of its land area | complete | US | 31.613748 | -84.222873 | https://data.sba.gov/sites/default/files/uploaded_resources/FOIA_7a_FY2020_Present_asof_260930.csv | ||||||||||||||||
| Securityplus Federal Credit Union | 7135 Windsor Blvd | Baltimore | MD | 21244 | NCUA-02769 | Credit union | 02769 | 2025-12-09 | Y | 2 | 2557000 | 0 | 0 | 0 | 0 | 1 | 0 | 0 | 1 | 0 | 0 | 0 | 0 | 0 | 0 | 0 | 0 | 0 | 0 | 0 | 0 | 0 | 0 | 0 | 0 | 0 | 0 | 0 | 0 | 0 | 0 | 0 | 0 | 0 | 0 | 0 | 0 | 0 | 0 | 0 | 0 | 0 | 0 | 0 | 0 | 0 | 0 | 0 | 0 | 0 | 0 | 0 | 0 | 0 | 0 | 0 | 0 | 0 | 0 | 0 | 0 | 0 | 0 | 0 | 0 | 0 | 0 | 0 | 0 | 0 | 0 | 1 | 468000 | 0 | 0 | 0 | 0 | 1 | 0 | 0 | 0 | 0 | 0 | 1 | 2089000 | 0 | 0 | 0 | 0 | 0 | 0 | 0 | 1 | 0 | 0 | 2089000 | 10 | 0 | 120 | 0 | 0 | 0 | 0 | 1 | 1 | 0 | 0 | 0 | 0 | 0 | 29 | 2025-08-26 | 2025-12-09 | 952 | 634 | 1424 | Full-Service Restaurants | 1 | MD | 1 | 2026-09-30 | FY2020-FY2026 | address | Baltimore County | 24005 | complete | US | 39.333233 | -76.749228 | https://data.sba.gov/sites/default/files/uploaded_resources/FOIA_7a_FY2020_Present_asof_260930.csv | ||
| The First National Bank of Absecon | 106 New Jersey Ave | Absecon | NJ | 08201 | FDIC-06442 | Bank | 06442 | 2025-03-26 | N | 6 | 3562500 | 2 | 733500 | 0 | 1 | 2 | 3 | 0 | 0 | 0 | 0 | 0 | 0 | 0 | 0 | 0 | 0 | 0 | 0 | 0 | 0 | 0 | 0 | 1 | 777000 | 0 | 0 | 0 | 0 | 0 | 1 | 0 | 0 | 0 | 0 | 1 | 433500 | 1 | 0 | 0 | 0 | 1 | 0 | 0 | 0 | 0 | 0 | 3 | 2052000 | 0 | 0 | 0 | 0 | 1 | 2 | 0 | 0 | 0 | 0 | 0 | 0 | 0 | 0 | 0 | 0 | 0 | 0 | 0 | 0 | 0 | 0 | 1 | 300000 | 1 | 0 | 0 | 1 | 0 | 0 | 0 | 0 | 0 | 0 | 0 | 0 | 0 | 0 | 0 | 0 | 0 | 0 | 0 | 0 | 0 | 0 | 0 | 0 | 0 | 0 | 2 | 1 | 54 | 2021-08-19 | 2025-03-26 | 1301 | 2026-09-30 | FY2020-FY2026 | address | Atlantic County | 34001 | complete | US | 39.424442 | -74.500493 | https://data.sba.gov/sites/default/files/uploaded_resources/FOIA_7a_FY2020_Present_asof_260930.csv | |||||||||||||||||
| Dacotah Bank | 308 S Main St | Aberdeen | SD | 57401 | FDIC-17437 | Bank | 17437 | 2026-08-27 | Y | 41 | 21393400 | 7 | 7751500 | 10 | 16 | 4 | 6 | 3 | 0 | 2 | 0 | 11 | 4839900 | 1 | 0 | 4 | 5 | 1 | 0 | 0 | 0 | 1 | 0 | 5 | 1423200 | 2 | 0 | 1 | 2 | 0 | 2 | 0 | 0 | 0 | 0 | 8 | 2206600 | 1 | 0 | 3 | 3 | 0 | 2 | 0 | 0 | 0 | 0 | 3 | 823700 | 0 | 0 | 1 | 1 | 1 | 0 | 0 | 0 | 0 | 0 | 5 | 1687000 | 1 | 0 | 1 | 1 | 2 | 1 | 0 | 0 | 0 | 0 | 5 | 7898000 | 2 | 1 | 0 | 1 | 0 | 1 | 2 | 0 | 1 | 0 | 4 | 2515000 | 0 | 0 | 0 | 3 | 0 | 0 | 1 | 0 | 0 | 0 | 628750 | 6.88 | 0.25 | 60 | 0 | 0.75 | 0 | 0 | 0.75 | 2 | 0 | 0 | 0 | 11 | 1 | 619 | 2019-11-15 | 2026-08-27 | 591 | 596 | 590 | Other Professional Equipment and Supplies Merchant Wholesalers | 0.5 | SD | 0.75 | 2026-09-30 | FY2020-FY2026 | address | Brown County | 46013 | complete | US | 45.462001 | -98.488116 | https://data.sba.gov/sites/default/files/uploaded_resources/FOIA_7a_FY2020_Present_asof_260930.csv |
{}What's in each row
| Field | What it is | Rows filled |
|---|---|---|
| lender_ | Row key: FDIC certificate number (FDIC-nnnn), NCUA charter number (NCUA-nnnn) or a name key (NAME-...) for non-bank lenders | 100% |
| name | Lender name as SBA records it | 100% |
| lender_ | Bank, Credit union or Non-bank lender | 100% |
| fdic_ | FDIC certificate number (banks) | 80% |
| ncua_ | NCUA charter number (credit unions) | 14% |
| address | Lender street address on its newest loan | 100% |
| city | Lender city | 100% |
| state | Lender state (two-letter code) | 100% |
| zip | Lender ZIP code | 100% |
| country | US | 100% |
| address_ | Approval date of the loan the address was read from | 100% |
| active_ | Y when the lender approved a loan in fiscal year 2026 | 100% |
| total_ | 7(a) loans approved FY2020 to FY2026, cancelled loans left out | 100% |
| total_ | Gross approval dollars FY2020 to FY2026 | 100% |
| total_ | Loans SBA flags as Change of Ownership (business acquisitions), FY2020 to FY2026 | 100% |
| total_ | Gross approval dollars on change-of-ownership loans | 100% |
| loans_ | Loans under $150,000, all years | 100% |
| loans_ | Loans of $150,000 to under $350,000, all years | 100% |
| loans_ | Loans of $350,000 to under $500,000, all years | 100% |
| loans_ | Loans of $500,000 to under $1 million, all years | 100% |
| loans_ | Loans of $1 million to under $2 million, all years | 100% |
| loans_ | Loans of $2 million to under $3 million, all years | 100% |
| loans_ | Loans of $3 million to under $5 million, all years | 100% |
| loans_ | Loans of $5 million, the 7(a) maximum, all years | 100% |
| fy2020_ | Loans approved in fiscal year 2020 (October 2019 to September 2020) | 100% |
| fy2020_ | Gross approval dollars in fiscal year 2020 | 100% |
| fy2020_ | Change-of-ownership (business acquisition) loans in fiscal year 2020 | 100% |
| fy2020_ | Change-of-ownership loans of $2.5 million and up in fiscal year 2020 | 100% |
| fy2020_ | Loans under $150,000 in fiscal year 2020 | 100% |
| fy2020_ | Loans of $150,000 to under $350,000 in fiscal year 2020 | 100% |
| fy2020_ | Loans of $350,000 to under $500,000 in fiscal year 2020 | 100% |
| fy2020_ | Loans of $500,000 to under $1 million in fiscal year 2020 | 100% |
| fy2020_ | Loans of $1 million to under $2 million in fiscal year 2020 | 100% |
| fy2020_ | Loans of $2 million to under $3 million in fiscal year 2020 | 100% |
| fy2020_ | Loans of $3 million to under $5 million in fiscal year 2020 | 100% |
| fy2020_ | Loans of $5 million in fiscal year 2020 | 100% |
| fy2021_ | Loans approved in fiscal year 2021 (October 2020 to September 2021) | 100% |
| fy2021_ | Gross approval dollars in fiscal year 2021 | 100% |
| fy2021_ | Change-of-ownership (business acquisition) loans in fiscal year 2021 | 100% |
| fy2021_ | Change-of-ownership loans of $2.5 million and up in fiscal year 2021 | 100% |
| fy2021_ | Loans under $150,000 in fiscal year 2021 | 100% |
| fy2021_ | Loans of $150,000 to under $350,000 in fiscal year 2021 | 100% |
| fy2021_ | Loans of $350,000 to under $500,000 in fiscal year 2021 | 100% |
| fy2021_ | Loans of $500,000 to under $1 million in fiscal year 2021 | 100% |
| fy2021_ | Loans of $1 million to under $2 million in fiscal year 2021 | 100% |
| fy2021_ | Loans of $2 million to under $3 million in fiscal year 2021 | 100% |
| fy2021_ | Loans of $3 million to under $5 million in fiscal year 2021 | 100% |
| fy2021_ | Loans of $5 million in fiscal year 2021 | 100% |
| fy2022_ | Loans approved in fiscal year 2022 (October 2021 to September 2022) | 100% |
| fy2022_ | Gross approval dollars in fiscal year 2022 | 100% |
| fy2022_ | Change-of-ownership (business acquisition) loans in fiscal year 2022 | 100% |
| fy2022_ | Change-of-ownership loans of $2.5 million and up in fiscal year 2022 | 100% |
| fy2022_ | Loans under $150,000 in fiscal year 2022 | 100% |
| fy2022_ | Loans of $150,000 to under $350,000 in fiscal year 2022 | 100% |
| fy2022_ | Loans of $350,000 to under $500,000 in fiscal year 2022 | 100% |
| fy2022_ | Loans of $500,000 to under $1 million in fiscal year 2022 | 100% |
| fy2022_ | Loans of $1 million to under $2 million in fiscal year 2022 | 100% |
| fy2022_ | Loans of $2 million to under $3 million in fiscal year 2022 | 100% |
| fy2022_ | Loans of $3 million to under $5 million in fiscal year 2022 | 100% |
| fy2022_ | Loans of $5 million in fiscal year 2022 | 100% |
| fy2023_ | Loans approved in fiscal year 2023 (October 2022 to September 2023) | 100% |
| fy2023_ | Gross approval dollars in fiscal year 2023 | 100% |
| fy2023_ | Change-of-ownership (business acquisition) loans in fiscal year 2023 | 100% |
| fy2023_ | Change-of-ownership loans of $2.5 million and up in fiscal year 2023 | 100% |
| fy2023_ | Loans under $150,000 in fiscal year 2023 | 100% |
| fy2023_ | Loans of $150,000 to under $350,000 in fiscal year 2023 | 100% |
| fy2023_ | Loans of $350,000 to under $500,000 in fiscal year 2023 | 100% |
| fy2023_ | Loans of $500,000 to under $1 million in fiscal year 2023 | 100% |
| fy2023_ | Loans of $1 million to under $2 million in fiscal year 2023 | 100% |
| fy2023_ | Loans of $2 million to under $3 million in fiscal year 2023 | 100% |
| fy2023_ | Loans of $3 million to under $5 million in fiscal year 2023 | 100% |
| fy2023_ | Loans of $5 million in fiscal year 2023 | 100% |
| fy2024_ | Loans approved in fiscal year 2024 (October 2023 to September 2024) | 100% |
| fy2024_ | Gross approval dollars in fiscal year 2024 | 100% |
| fy2024_ | Change-of-ownership (business acquisition) loans in fiscal year 2024 | 100% |
| fy2024_ | Change-of-ownership loans of $2.5 million and up in fiscal year 2024 | 100% |
| fy2024_ | Loans under $150,000 in fiscal year 2024 | 100% |
| fy2024_ | Loans of $150,000 to under $350,000 in fiscal year 2024 | 100% |
| fy2024_ | Loans of $350,000 to under $500,000 in fiscal year 2024 | 100% |
| fy2024_ | Loans of $500,000 to under $1 million in fiscal year 2024 | 100% |
| fy2024_ | Loans of $1 million to under $2 million in fiscal year 2024 | 100% |
| fy2024_ | Loans of $2 million to under $3 million in fiscal year 2024 | 100% |
| fy2024_ | Loans of $3 million to under $5 million in fiscal year 2024 | 100% |
| fy2024_ | Loans of $5 million in fiscal year 2024 | 100% |
| fy2025_ | Loans approved in fiscal year 2025 (October 2024 to September 2025) | 100% |
| fy2025_ | Gross approval dollars in fiscal year 2025 | 100% |
| fy2025_ | Change-of-ownership (business acquisition) loans in fiscal year 2025 | 100% |
| fy2025_ | Change-of-ownership loans of $2.5 million and up in fiscal year 2025 | 100% |
| fy2025_ | Loans under $150,000 in fiscal year 2025 | 100% |
| fy2025_ | Loans of $150,000 to under $350,000 in fiscal year 2025 | 100% |
| fy2025_ | Loans of $350,000 to under $500,000 in fiscal year 2025 | 100% |
| fy2025_ | Loans of $500,000 to under $1 million in fiscal year 2025 | 100% |
| fy2025_ | Loans of $1 million to under $2 million in fiscal year 2025 | 100% |
| fy2025_ | Loans of $2 million to under $3 million in fiscal year 2025 | 100% |
| fy2025_ | Loans of $3 million to under $5 million in fiscal year 2025 | 100% |
| fy2025_ | Loans of $5 million in fiscal year 2025 | 100% |
| fy2026_ | Loans approved in fiscal year 2026 (October 2025 to September 2026) | 100% |
| fy2026_ | Gross approval dollars in fiscal year 2026 | 100% |
| fy2026_ | Change-of-ownership (business acquisition) loans in fiscal year 2026 | 100% |
| fy2026_ | Change-of-ownership loans of $2.5 million and up in fiscal year 2026 | 100% |
| fy2026_ | Loans under $150,000 in fiscal year 2026 | 100% |
| fy2026_ | Loans of $150,000 to under $350,000 in fiscal year 2026 | 100% |
| fy2026_ | Loans of $350,000 to under $500,000 in fiscal year 2026 | 100% |
| fy2026_ | Loans of $500,000 to under $1 million in fiscal year 2026 | 100% |
| fy2026_ | Loans of $1 million to under $2 million in fiscal year 2026 | 100% |
| fy2026_ | Loans of $2 million to under $3 million in fiscal year 2026 | 100% |
| fy2026_ | Loans of $3 million to under $5 million in fiscal year 2026 | 100% |
| fy2026_ | Loans of $5 million in fiscal year 2026 | 100% |
| fy2026_ | Average gross approval in FY2026, dollars | 53% |
| fy2026_ | Average initial interest rate on FY2026 loans, percent | 53% |
| fy2026_ | Share of FY2026 loans at a variable rate (0 to 1) | 53% |
| fy2026_ | Average term of FY2026 loans, months | 53% |
| fy2026_ | Share of FY2026 loans processed under the Preferred Lenders Program | 53% |
| fy2026_ | Share of FY2026 loans processed as SBA Express | 53% |
| fy2026_ | Share of FY2026 loans sold on the secondary market | 53% |
| fy2026_ | Share of FY2026 loans to franchise businesses | 53% |
| fy2026_ | Share of FY2026 loans to startups or businesses two years old or less | 53% |
| fy2026_ | Number of borrower states in FY2026 | 100% |
| charge_ | Loans charged off, FY2020 to FY2026 | 100% |
| charge_ | Gross charge-off dollars | 100% |
| charge_ | Charge-offs divided by approved loans (0 to 1) | 99% |
| paid_ | Loans paid in full | 100% |
| cancelled | Loans canceled before disbursement; not in any other count | 100% |
| jobs_ | Jobs supported as reported on the loan applications | 100% |
| first_ | Earliest approval date in the file | 99% |
| last_ | Latest approval date in the file | 99% |
| fy2026_ | Rank among all lenders by FY2026 loan count (blank when none) | 53% |
| fy2026_ | Rank among all lenders by FY2026 dollars (blank when none) | 53% |
| rank_ | Rank by dollars approved FY2020 to FY2026 | 100% |
| fy2026_ | Most common borrower industry in FY2026 (NAICS description) | 53% |
| fy2026_ | Share of FY2026 loans in that industry | 53% |
| fy2026_ | State with the most FY2026 borrowers | 53% |
| fy2026_ | Share of FY2026 loans in that state | 53% |
| latitude | Head office latitude (Census geocoder; see geo precision) | 100% |
| longitude | Head office longitude | 100% |
| source_ | The SBA FOIA file the row was built from | 100% |
| source_ | The as-of date of that file | 100% |
| fiscal_ | FY2020-FY2026 | 100% |
| geo_ | address, zip centroid or city centroid | 100% |
| county | County of the head office | 100% |
| county_ | County FIPS code | 100% |
| county_ | Set when the ZIP spans more than one county | 32% |
| address_ | complete, no house number or po box | 100% |
Rows filled is measured on every row of the delivered file.
✓Where this data comes from
This dataset is built from the FDIC BankFind Suite — the institution table, the office-location table (every office an insured institution has registered with the FDIC, from the main office to loan production offices) and the annual Summary of Deposits survey — joined on the FDIC's own branch and certificate ids. Nothing here comes from a bank's website; every row is the institution's own registered entry, and the service_type column says what kind of office it is. The FDIC publishes no telephone numbers, and none are appended.
November 7, 2026
Snapshot built
143 fields
Columns in the file
Fill measured
On every row of the delivered file
Offices are published as the FDIC holds them; the only rows removed are the foreign offices of US banks (London, Nassau, Buenos Aires…), which are counted and stated on each dataset. Coordinates are validated to US bounds and blanked where the register's value was impossible; dates are normalised to ISO. Deposit figures are joined from the June 30 Summary of Deposits and carry that survey date on every row, so an office opened since the survey shows a blank rather than a guess.
How we build and date every file: methodology.
Using ChatGPT, Claude or an API?
No setup needed. Ask ChatGPT or Claude your question about the SBA 7(a) Lenders and give it this page: it can open https://locationlists.com/find?dataset=sba-7a-lender-list with the filters you need and show you the count and price.
Using ChatGPT or Claude? Tell it to answer from locationlists.com/find — no account, no connector.
How assistants ask
No connector needed. Any AI assistant can answer from this site with a web link, no connector, no account: open https://locationlists.com/find with the question as query parameters.
If a question needs filtering, distance, combining lists or a price, open a /find link: either put the question itself in q=, or build the structured link. The answer does not need an API, a connector or an account.
Simplest, the question itself: https://locationlists.com/find?q=<the question in plain words>
Or set the parts yourself: https://locationlists.com/find?dataset=<slug>&state=<ST>&city=<city>&county=<county>&zip=<zip>&near=<place or zip>&radius=<miles>&where=<column>:<op>:<value>&total=<rows>
Leave out what the question does not need. Distance is radius, in straight-line miles; near can name several places separated by | to reach from any of them. To ask about several lists at once, use datasets with two or more names, or category with a kind of business. To compare two lists, add relate=nearest and the other list with b. in front of its parameters. To count by area, use areas=county (or zip, state, metro). To keep only places whose county, ZIP code, metro area or state meets a Census figure, add area_where (for example county:population>1000000); with areas, per=100000 gives counts per 100,000 residents.
Links an assistant can open, each showing how many rows match, a few preview rows and the price for just that part:
- Only Minnesota, the state with the most: https://locationlists.com/find?dataset=sba-7a-lender-list&state=MN
- Within 25 miles of Minneapolis, MN, the busiest area: https://locationlists.com/find?dataset=sba-7a-lender-list&near=Minneapolis+MN&radius=25
- Only rows where active_fy2026 is Y: https://locationlists.com/find?dataset=sba-7a-lender-list&where=active_fy2026%3Aeq%3AY
- Every Banks & Bank Branches list combined, within 25 miles of New York, NY: https://locationlists.com/find?category=bank-branches&near=New+York+NY&radius=25
- Each one's nearest US Bank Branches — Every FDIC-Insured Office, in Minnesota, with miles: https://locationlists.com/find?dataset=sba-7a-lender-list&state=MN&relate=nearest&k=1&b.dataset=us-bank-branches-every-fdic-insured-office&b.state=MN
- The whole list: add a city, state, ZIP code or distance:
https://locationlists.com/find?dataset=sba-7a-lender-list - In plain words: "SBA 7(a) Lenders in Minnesota": https://locationlists.com/find?q=SBA+7(a)+Lenders+in+Minnesota
- In plain words: "SBA 7(a) Lenders within 25 miles of Minneapolis, MN": https://locationlists.com/find?q=SBA+7(a)+Lenders+within+25+miles+of+Minneapolis%2C+MN
Optional: connect for repeat use or wallet payments:
Read https://locationlists.com/skill.md and follow the instructions to connect LocationLists. Then show me the SBA 7(a) Lenders list.Your assistant will walk you through setup and show you the price before you pay.
For developers
At 2,341 records this dataset is not sold by the row — buy the file. Without a connector, open https://locationlists.com/find?dataset=sba-7a-lender-list. An agent connected to https://locationlists.com/mcp can still search it, read a free sample file of up to 10 rows and buy the whole file itself. How agent purchasing works
?Frequently Asked Questions
How many SBA 7(a) Lenders are there in the US?
There are 2,341 SBA 7(a) Lenders in the US as of November 2026. They are in all 50 states, DC and Puerto Rico.
What counts as a lender?
One row per lending institution. The key is the FDIC certificate number for a bank, the NCUA charter number for a credit union and the name for a non-bank lender. A bank that was bought keeps its own row for the loans it made under its own certificate. The address is the lender address SBA recorded on the lender's newest loan, geocoded by the Census Bureau.
Which loans are counted?
Every 7(a) loan SBA approved from 1 October 2019 to 30 September 2026, except loans canceled before disbursement. Those are in the cancelled column only. Charged-off and paid-in-full loans stay in the counts because they were made. The size bands are on the gross approval amount, which is the loan, not the purchase price of the business.
What is a change-of-ownership loan?
SBA marks each loan with the borrower's business age. Change of Ownership means the loan funded the purchase of an existing business. Since October 2026 SBA requires a lender-engaged quality of earnings report on acquisitions of $3 million and up. The $2.5 million-plus columns show which lenders see those deals. SBA does not flag a loan that funds an expansion by acquisition. Those loans are not in these columns.
Is there a phone number or a contact?
No. SBA's file carries the lender's name and address only. Join on fdic_cert to our US bank lists for branch counts and deposits.
How is this different from SBA's own lender report?
SBA's weekly lender report gives each lender's loan count and dollars for the current fiscal year. This file adds seven fiscal years, eight size bands for each year, acquisition loans, rates, terms, processing mix, charge-offs and rank. It also places each head office on a map.
When is it refreshed?
Snapshot built on November 7, 2026. It is a one-time snapshot and is not rebuilt on a schedule.